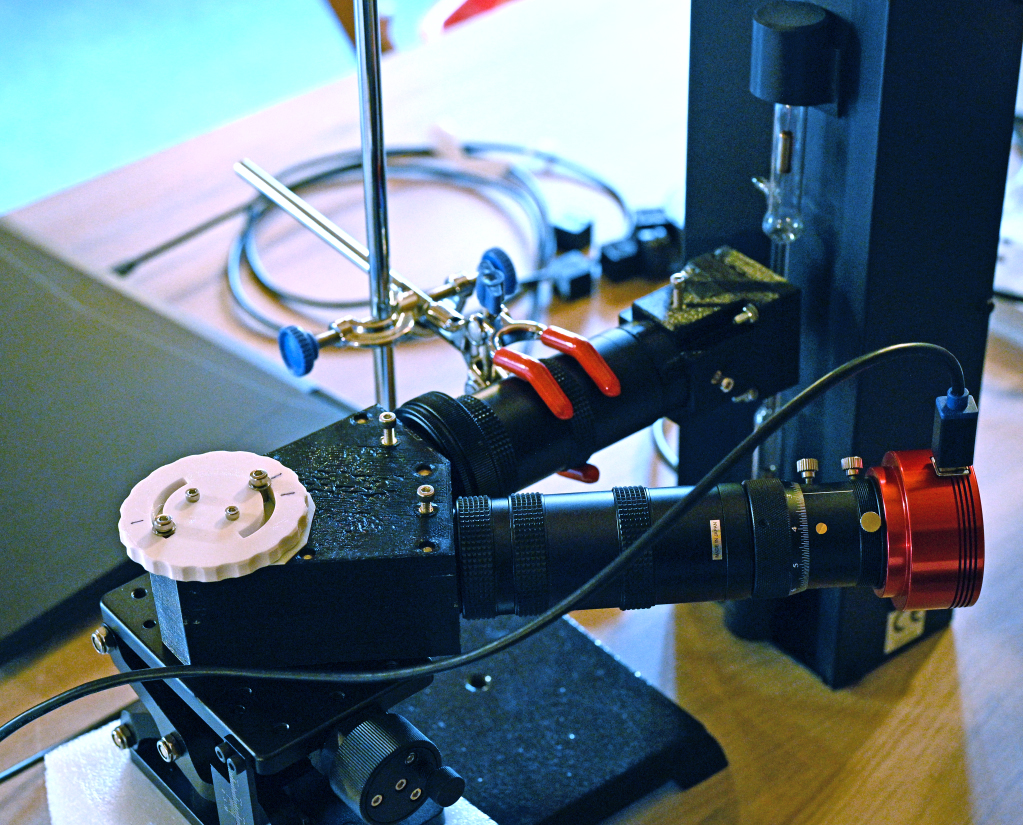
Characteristics of Sol'Ex configurations used for measuring filters and etalons
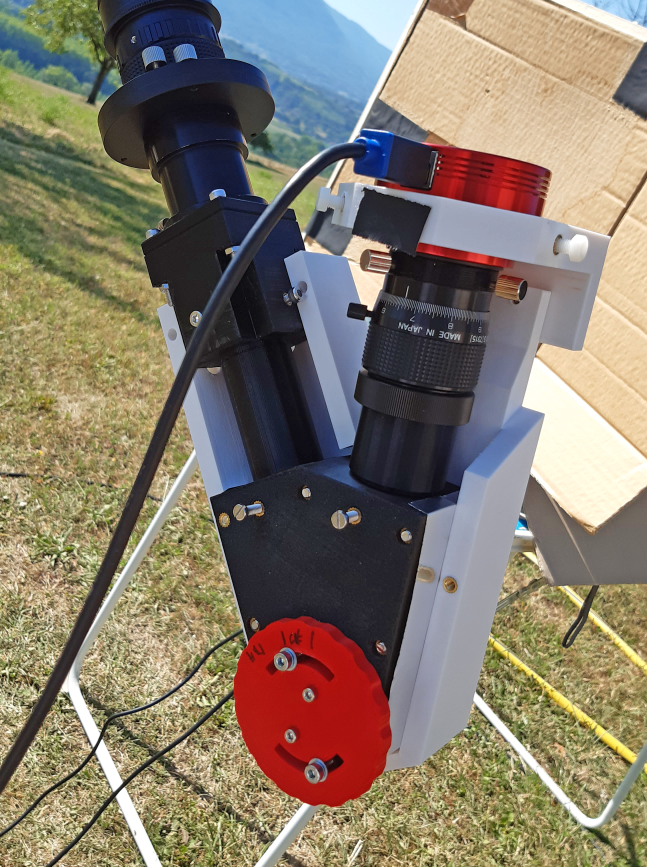
Configuration with 125 mm f.l. collimator, 125 mm f.l. imager and ASI290.
Left: f/115 near collimated beam. The slit is directly illuminated by the Sun.
Right: rugerized version at the f/30 focus of a Celestron 8 (telecentric beam)
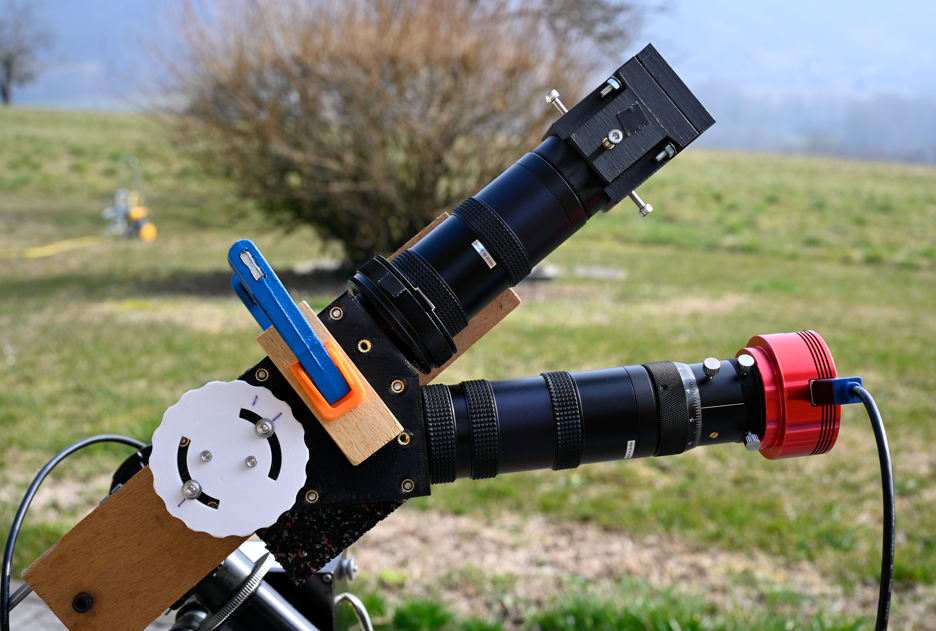
Configuration with
200 mm f.l. collimator, 200 mm f.l. imager and ASI290.
Note the M42 focusing ring
on the collimator tube (both collimating and ilmaging lenses are focused depending on the wavelength used).
Dispersion and theoritical spectral resolution
Theoritical
spectral resolution is calculated using Simspec (developped by Ken
Harrison).
The collimated and imaging lenses are assummed to be diffraction limited : FWHM = lambda × f-number
| Configuration |
Dispersion near Ca II |
Dispersion near Ha |
Theoritical spectral
resolution near Ca II |
Theoritical spectral
resolution near Ha |
| 80 mm f.l. collimator + 2400 l/m grating + 125 f.l. mm imaging lens + ASI 290 |
0.093 A/px |
0.075 A/px |
|
0.22 A |
| 125 mm f.l. collimator + 1200 l/m grating + 125 f.l. mm imaging lens + ASI 290 |
0.193 A/px |
0.192 A/px |
|
0.70 A |
| 125 mm f.l. collimator + 2400 l/m grating + 125 f.l. mm imaging lens + ASI 290 |
0.0933 A/px |
0.0755 A/px (measured) |
|
0.20 A |
| 125 mm f.l. collimator + 2400 l/m grating + 125 f.l. mm imaging lens + 2.22× Barlow + ASI 290 |
|
0.0336 A/px (measured) |
|
|
| 200 mm f.l. collimator + 2400 l/m grating + 200 f.l. mm imaging lens + 10 microns slit + ASI 290 |
0.0582 A/px (measured) |
0.0471 A/px (measured) |
0.18 A |
0.15 A |
| 200 mm collimator + 2400 l/mm grating + 200 mm imaging lens + 7 microns slit + ASI 290 |
|
|
0.15 A |
0.14 A |
| 10 micron slit + 200 mm collimator + 3600 l/mm grating + 200 mm imaging lens + 2.9 micron pixel sensor |
0.0347 A/px |
|
0.087 A |
|
Measured spectral resolution using fine lines of the solar spectrum
| Configuration |
FWHM for Ca K |
FWHM for Ha |
| 10 micron slit + 125 mm collimator + 2400 l/mm grating + 125 mm imaging lens + 2.9 micron pixel sensor |
about 0.20 A |
between 0.17 to 0.18 A |
| 125 mm collimator + 2400 l/m grating + 125 mm imaging lens + 2.22× Barlow + 2.9 micron pixel sensor |
|
between 0.15 to 0.16 A |
| 10 micron slit + 200 mm collimator + 2400 l/mm grating + 200 mm imaging lens + 2.9 micron pixel sensor |
about 0.16 A |
between 0.15 to 0.16 A |
| 7 micron slit + 200 mm collimator + 2400 l/mm grating + 200 mm imaging lens + 2.9 micron pixel sensor |
about 0.14 A |
between 0.15 to 0.16 A |
| 10 micron slit + 200 mm collimator + 3600 l/mm grating + 200 mm imaging lens + 2.9 micron pixel sensor |
better than 0.10 A |
|
Measurement of SHG spectral resolution using thin lines in the solar spectrum
Some interesting lines (Ca II, G-band, Mg triplet, Na, Ha)
Measurement of the linewidth of a hydrogen lamp
Interference fringes in the cover slit of sensor
Measurement of SHG spectral resolution using thin lines of the solar spectrum
Some definitions first:
The spectral resolution of a spectroscope can be defined in several ways.
It is usually defined as
the ability to distinguish between two wavelengths separated by a small
amount Δλ and expressed in terms of the dimensionless
quantity: R = λ / Δλ
Another way to look at it is
through the "bandpass" of the spectroscope, in other words, the FWHM of
a monochromatic line observed with the spectroscope:
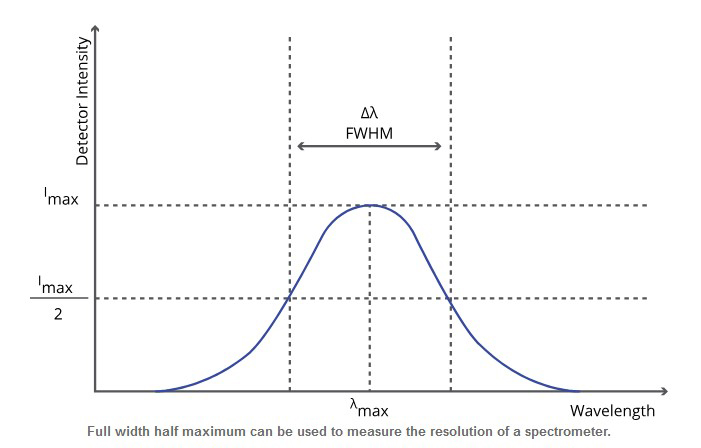
Using this definition, we can compare the bandpass of a SHG with the bandpass of an etalon (all expressed in Angström).
We can note an analogy with the resolution of optical telescopes:
- the angular resolution (Resolving Power) of a telescope can be
defined as the ability to distinguish the two components of a double
star. A common relationship is : RP = 120/D, where RP is in arsec and D
is in mm,
- another way to define the resolution of a telescope is the FWHM of the image of a star observed at its focus. The theoretical relationship is:
FWHM = lambda/D
- the "response" function of the telescope is called the Point Spread
Function (PSF). The FWHM is the width measured at the half
maximum of the PSF profile.
In a same way, for a spectroscope, the "response" function is the "Line Spread
Function (LSF). This is the image of a monochromatic line produced by the
spectroscope.
NB : difference between spectral resolution (A) and dispersion (A/pixel).
Spectral resolution should not be confused with dispersion.
Going to the analogy with the angular resolution of a telescope:
- spectral
resolution (A) is the analog of "angular resolution (arsec)",
- while "dispersion (A/pixel)" is the analog of sampling (arsec/pixel).
Methodology:
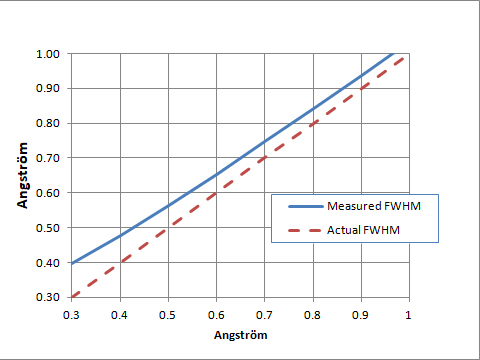
Ideally, in order to measure the spectral resolution of a spectroscope, we would measure the FWHM of a monochromatic line.
However, when we look at the solar spectrum, even the
thinnest lines have a sizable FWHM. In addition, the thinner
the line the lower the contrast, which makes it them more difficult to
measure accurately.
So, have to take into account the "true" FWHM of the measured lines in order to calculate the spectral resolution (FWHM_spectro) of the spectroscope.
The procedure is as follows:
- measurement of the true FWHM (FWHM_true)
of a very thin line of the solar spectrum using the very high
resolution solar spectrum of BASS2000 (dispersion = 0.002 A/px),
- measurement
of the FWHM (FWHM_measured) of the same line with the
spectroscope. Compared to the true FWHM of the line, the
measured FWHM is broaded by the "response function" of the
spectrograph.
- if we call FWHM_spectro the bandwidth of the spectroscope, we have the relationship:
FWHM_measured
2 = FWHM_true
2 + FWHM_spectro
2
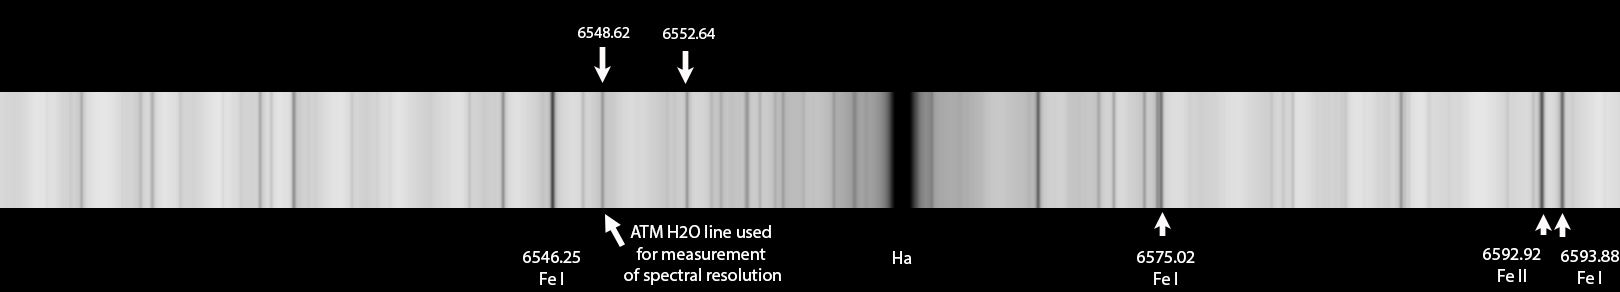
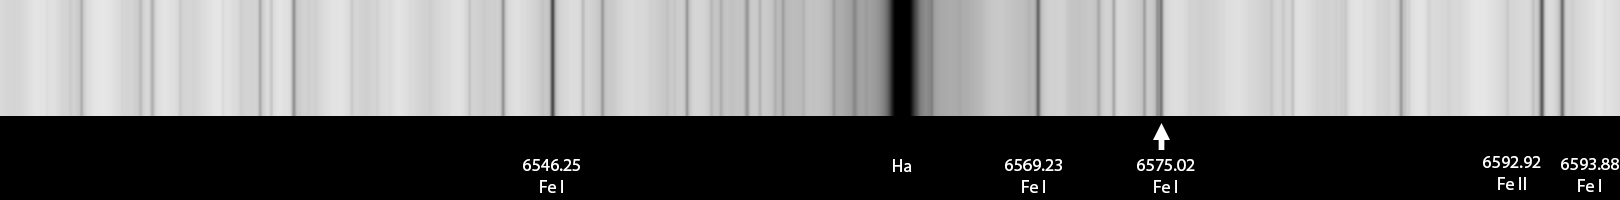
Reference "thin" lines near Ha:
The three following "thin" lines are used for the measurements:
- Fe I at 6546.25 A with true FWHM = 0.127 A,
- ATM at 6548.62 with true FWHM = 0.0537A,
- ATM at 6552.6A with true FWHM = 0.0589 A.
The true FWHM of these lines was measured by fitting a Voigt function
to their profiles extracted from BASS2000 very high resolution solar
spectrum.
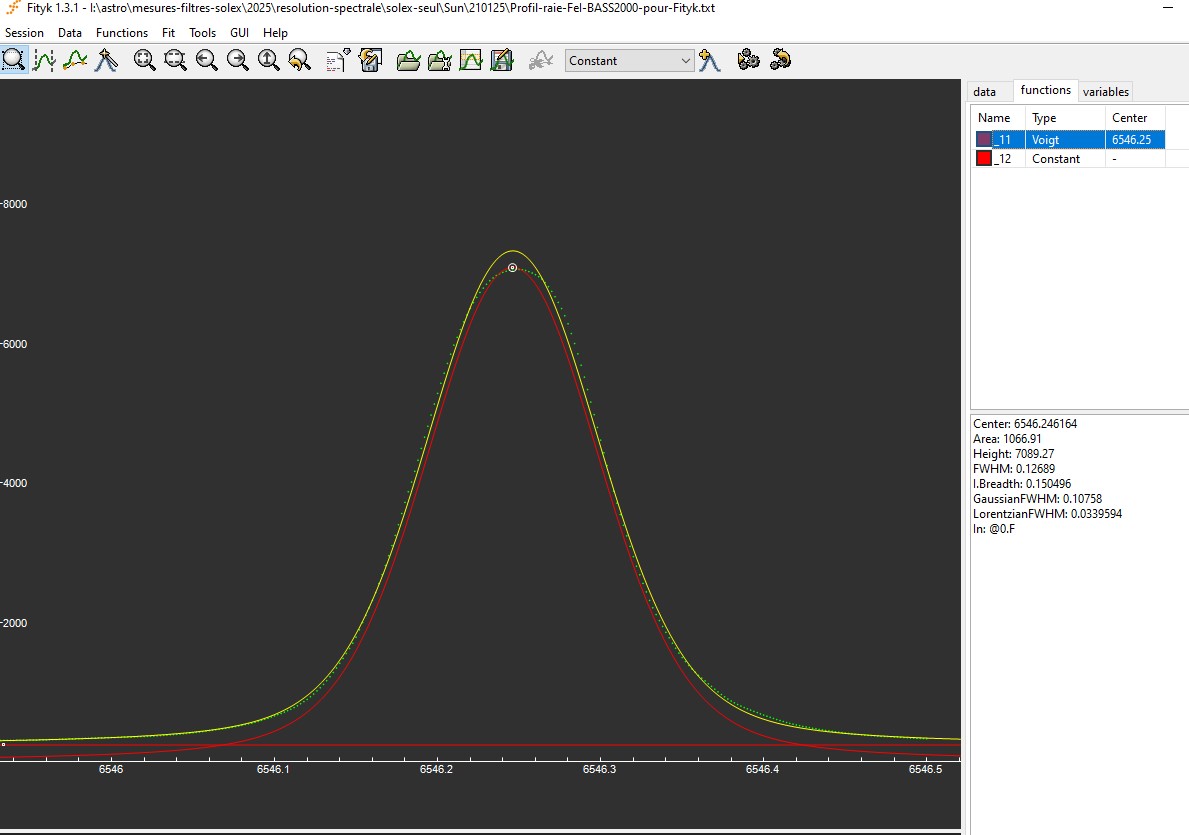
Measuring the "true" FWHM of Fe I at 6546.25 A:
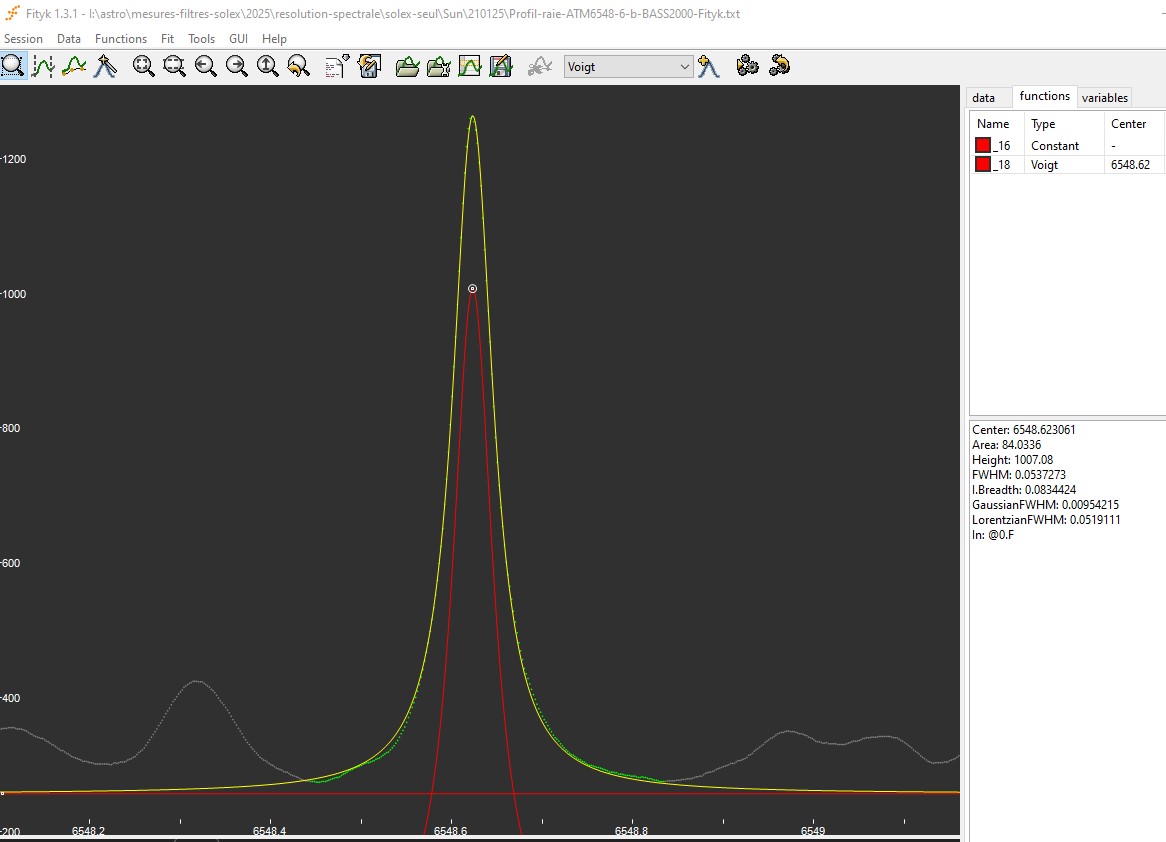
Measuring the "true" FWHM of ATM
6448.62 A using BASS2000:
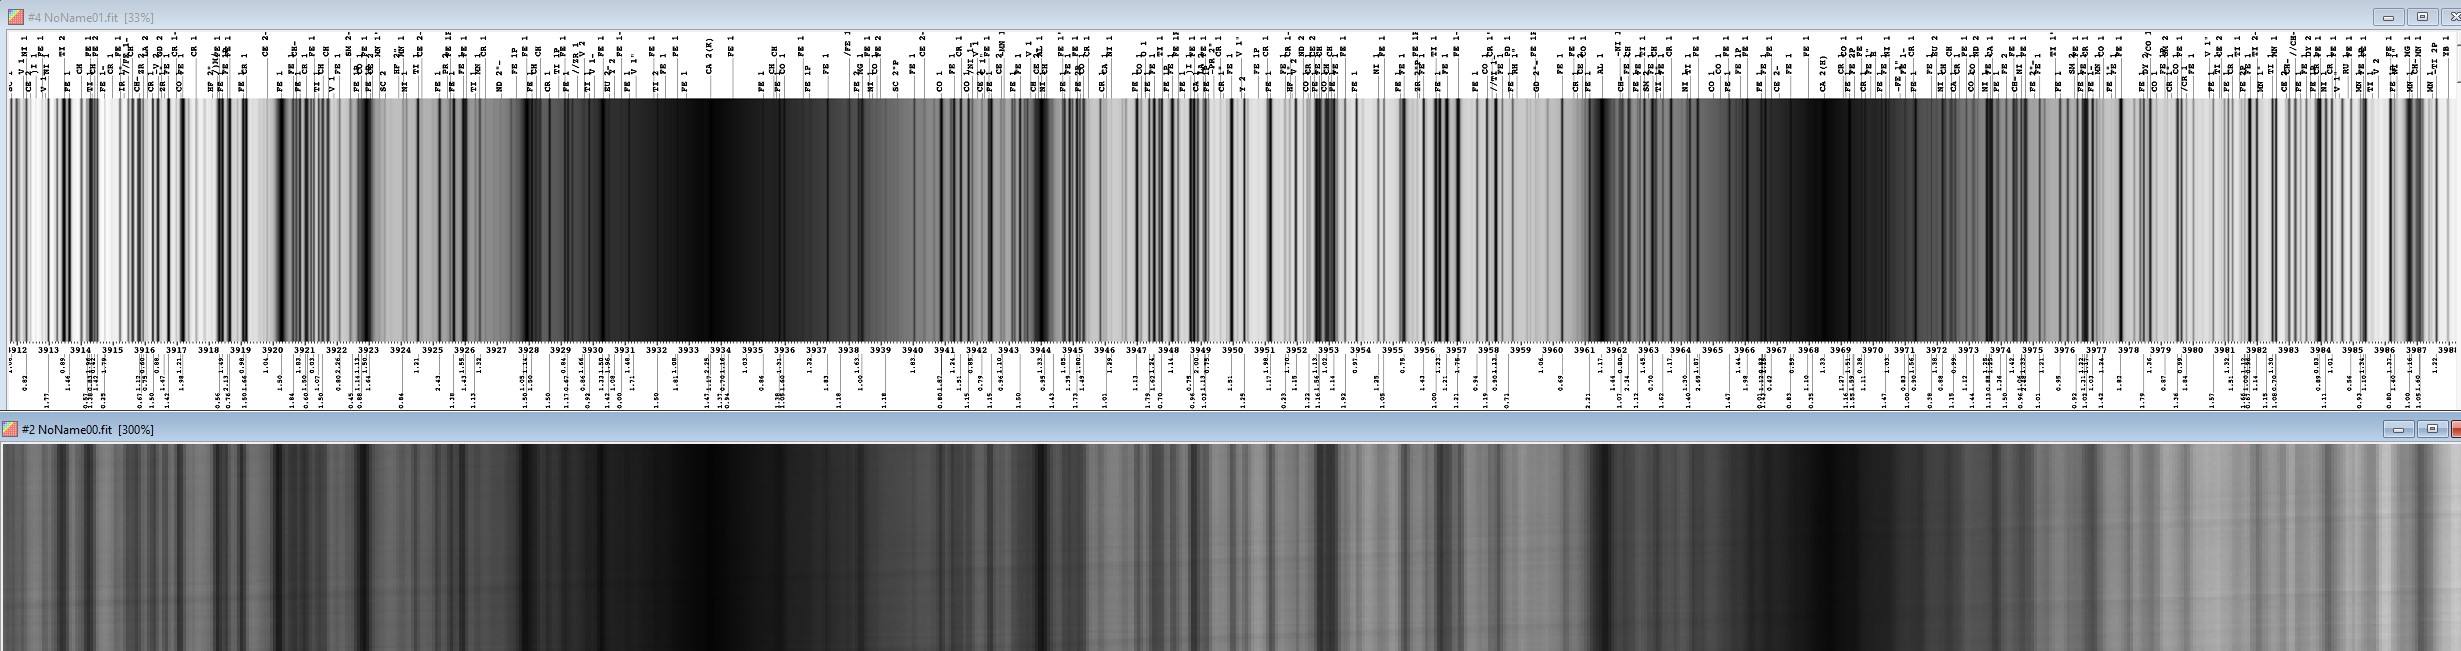
Reference "thin" lines near Ca K:
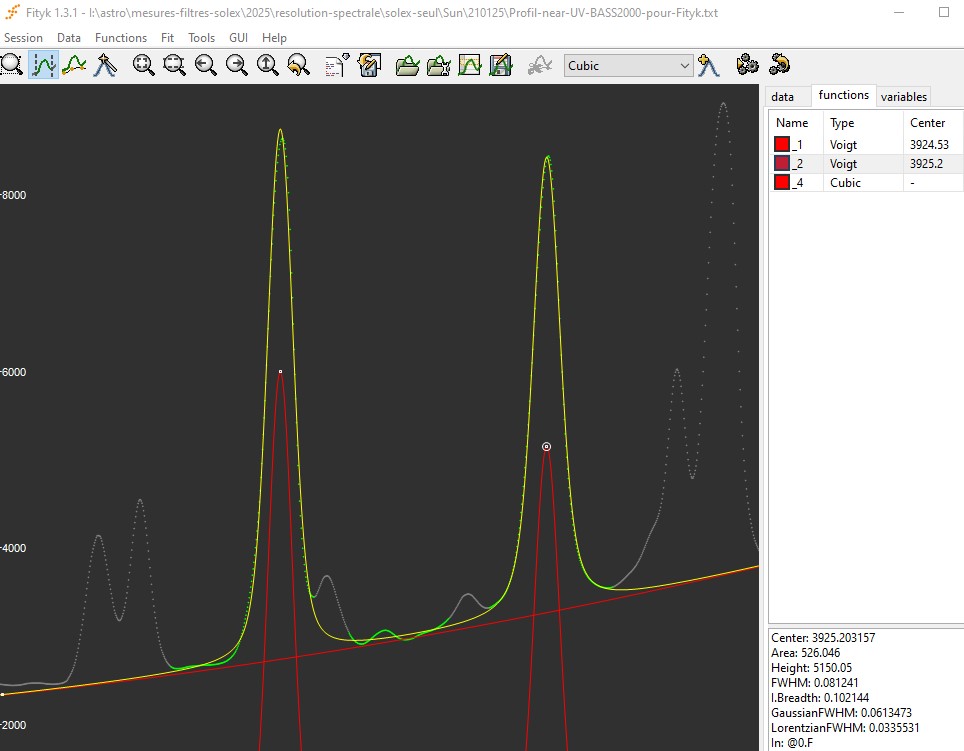
The following "thin" lines are used for the measurements:
-Ti 3924.5 A (FWHM = 0.077 A)
- Fe I 3925.2 A (FWHM = 0.081 A).
Both are labelled hereafter
with cross marks:
The true FWHM of these lines was measured by fitting a Voigt
functon to their profile taken from BASS2000 high resolution solar
spectrum:
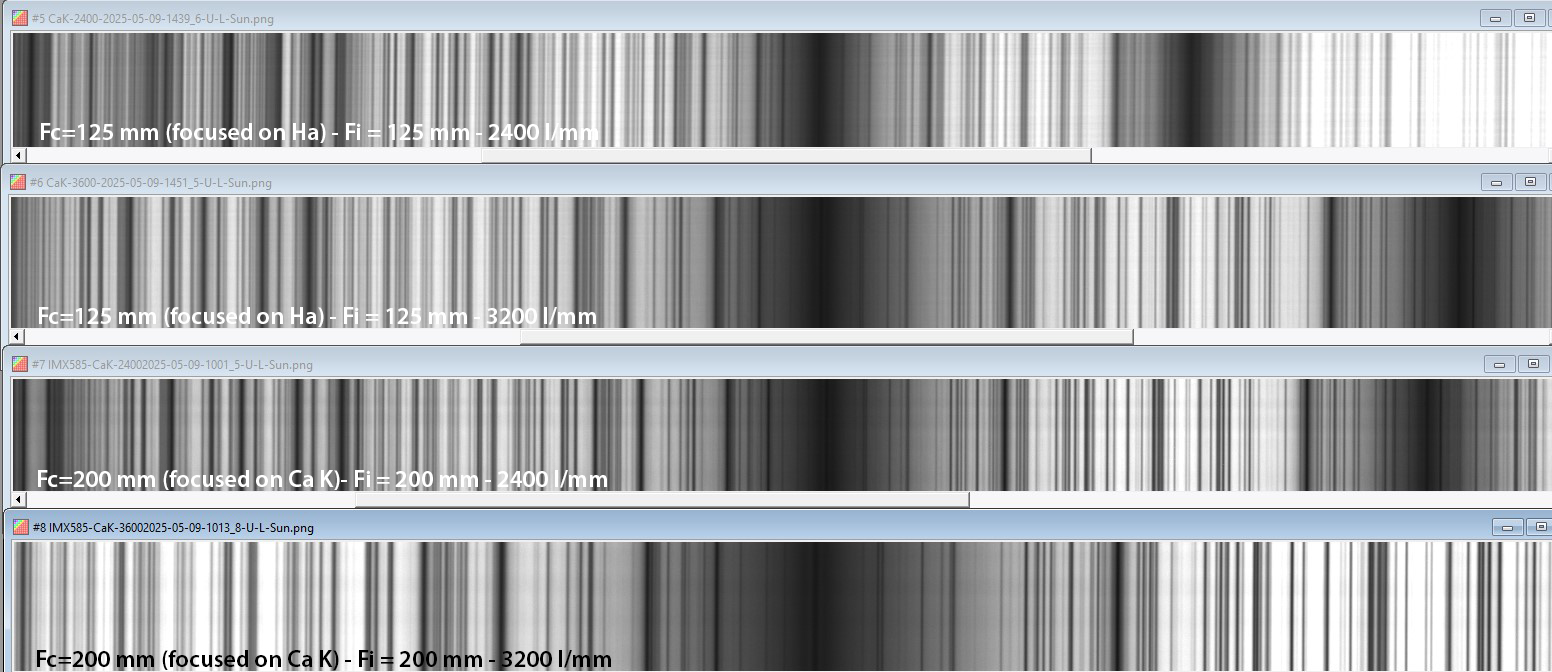
1) 10 micron slit, 125 mm f.l. collimating lens, 2400 l/mm grating, 125 mm f.l. imaging lens, ASI290
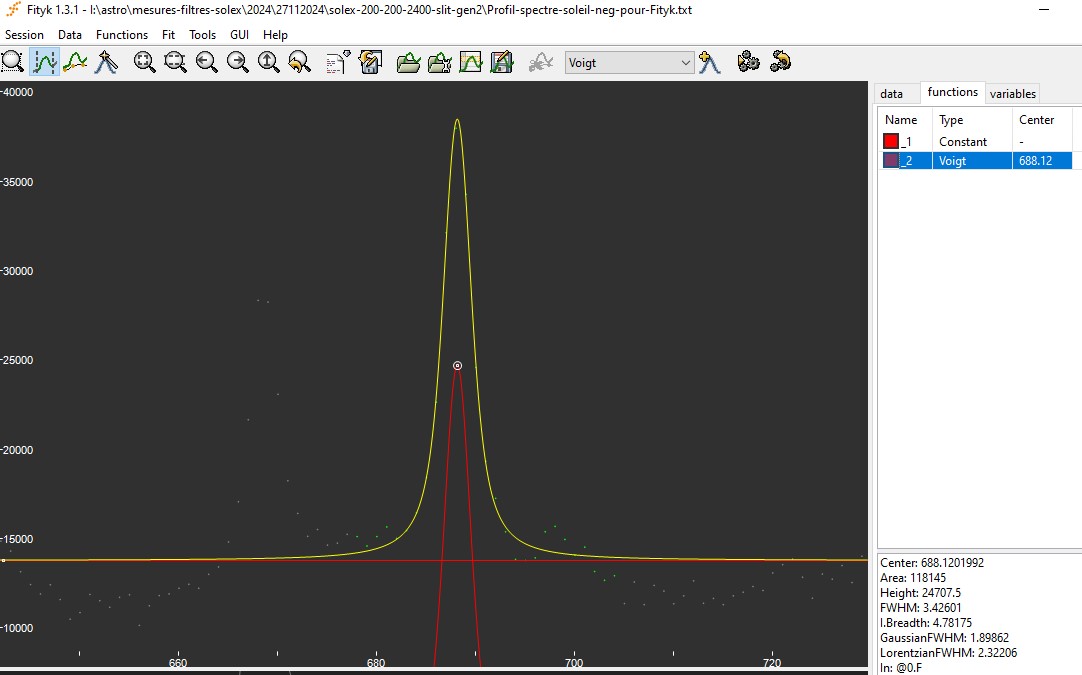
Spectral resolution near Ha:
The following
figure illustrates the measured profile of the ATM6548.61 A
line (green dots) and the fit with a Voigt function (yellow
curve).
The measured FWHM is 2.38 pixels × 0.0755 (A/pixel) = 0.180 A.
Given that the true FWHM of the line is 0.0537 A, the spectral
resolution of the spectroscope is equal to: square
root ( FWHM_measured2 - FWHM_true2) = 0.173 A.
Using the average over the three spectral
lines described above, the spectral resolution of the spectroscope
near Ha was found to be in the range of 0.17 to 0.18 A.
Spectral resolution near Ca K:
The collimating lens was refocussed on Ca K.
The FWHM of the Ti line at 3924.5A was measured (30 April 2022):
FWHM_mesured =
2.33 pixels = 0.217 A.
Given that the true FWHM of the line is 0.077 A, the spectral
resolution of the spectroscope is equal to: square
root ( FWHM_measured2 - FWHM_true2) = 0.20 A.
NB : the Fe I line at 3925.2 A was not measurable.
2) 10 micron slit, 200 mm f.l. collimating lens, 2400 l/mm grating, 200 mm f.l. imaging lens, ASI290
Spectral resolution near Ha :
The FWHM of the ATM H2O line at 6548.62 A was measured at 0.167 A (curve fitting with Voigt function).
Taking into account the true bandwidth of the line, we get a spectral resolution in the range of 0.15 to 0.16 A.
Spectral resolution between Ca K and H :
The measured FWHM is 0.17 A for the finest lines (measurement is
made difficult because of the densitry of spectral lines near Ca II).
Resulting spectral resolution is FHWM_spectro = 0.16 A.
3) 10 micron slit, 200 mm f.l. collimating lens, 3200 l/mm grating, 200 mm f.l. imaging lens, IMX585
Spectral resolution near Ca K:
Using the Fe I line at 3937.33 A, we measured a spectral resolution better than 0.10 A.
(measured 19 May 2025)
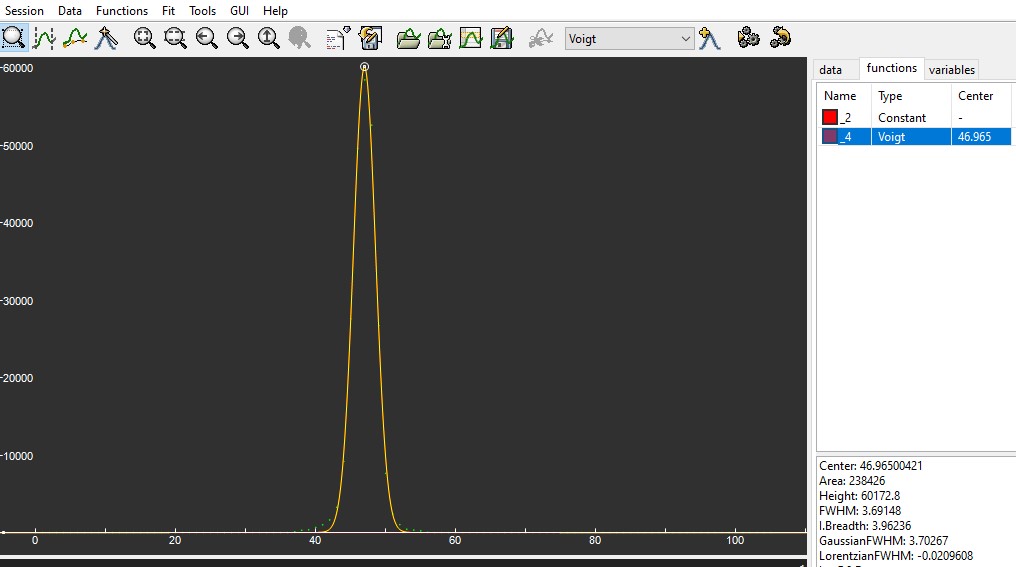
4) 7 micron slit, 200 mm f.l. collimating lens, 2400 l/mm grating, 200 mm f.l. imaging lens, ASI290
Spectral resolution near Ha :
Measured FWHM 3.42 x 0.0471 = 0.161 A (curve fitting by Voigt function, 20 points sampling, using the ATM H2O line at 6548.62 A).
Resulting spectral resolution : 0.0152 A
Spectral resolution near Ca K :
FHWM_measured for Ti line at 3924.5 A = 2.53 x 0.0582 = 0.147 A (curve fitting by Voigt function, 10 points sampling).
Given that the true FWHM of this line si 0.077 A, we can estimate the
spectral resolution at: FWHM_spectro = 0.14 A
5) 10 micron slit, 125 mm f.l. collimating lens, 2400 l/mm grating, 125 mm f.l. imaging lens + 2.22× Barlow lens, ASI290
Spectral resolution near Ha :
Using the three "thin" lines described above, we have spectral resolution = 0.15 to 0.16 A
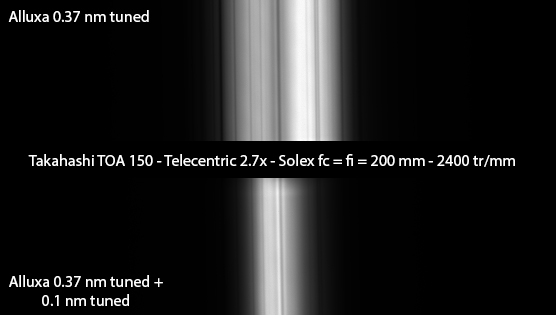
Field coverage of the Thorlabs 200 mm f.l. lens:
About 6 mm in diameter in Ca II and Ha, which is comparable to the length of Solex gen 2 slit (6 mm).
Ca II K and H lines
Sol'Ex V2 configuration: 10 micron slit, 200 mm f.l. collimating lens, 2400 l/mm grating, 200 mm f.l. imaging lens, ASI290:
Solar limb taken with the Takahashi TOA150 and Sol'Ex V2. Visible
beyond the photospheric limb are Ca K3(absorption), Ca K2r and v
(emisison), Ca H3 (absorption), H2r and v (emission), and H
epsilon lines:
Sol'Ex V1 configuration: 10 micron slit, 125 mm f.l. collimating lens, 2400 l/mm grating, 125 mm f.l. imaging lens, ASI290:
Top image : reference very high resolution solar spectrum with lines labelled. Bottom : spectrum obtained with Sol'Ex.
G-band
Sol'Ex V2 configuration: 10 micron slit, 200 mm f.l. collimating lens, 2400 l/mm grating, 200 mm f.l. imaging lens, ASI290:
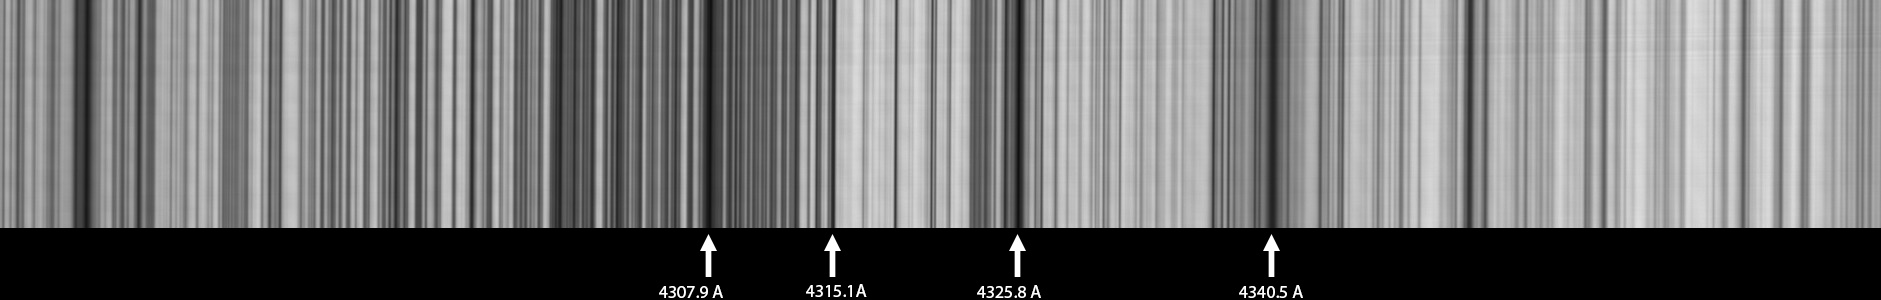
Sol'Ex V0 configuration: 10 micron slit, 80 mm f.l. collimating lens, 2400 l/mm grating, 125 mm f.l. imaging lens, ASI290: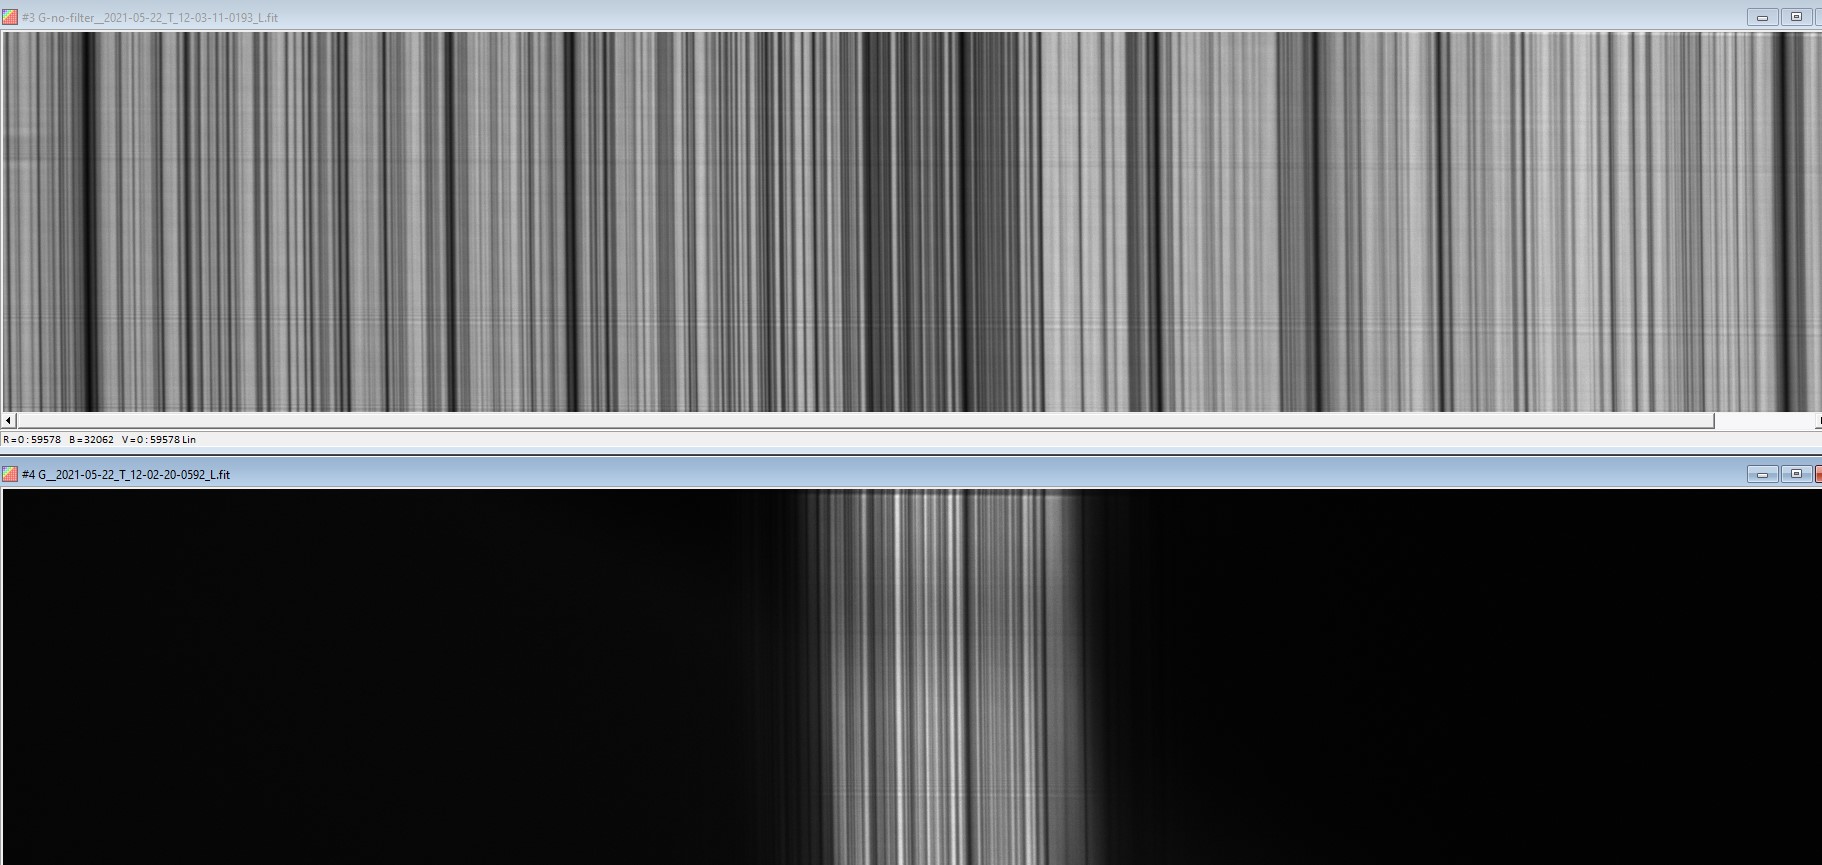
Mg triplet
Sol'Ex V2: configuration: 10 micron slit, 200 mm f.l. collimating lens, 2400 l/mm grating, 200 mm f.l. imaging lens, ASI290:
Sol'Ex V0: configuration: 10 micron slit, 80 mm f.l. collimating lens, 2400 l/mm grating, 125 mm f.l. imaging lens, ASI290:
Na doublet
Sol'Ex configuration: 10 micron slit, 80 mm f.l. collimating lens, 2400 l/mm grating, 125 mm f.l. imaging lens, ASI290:
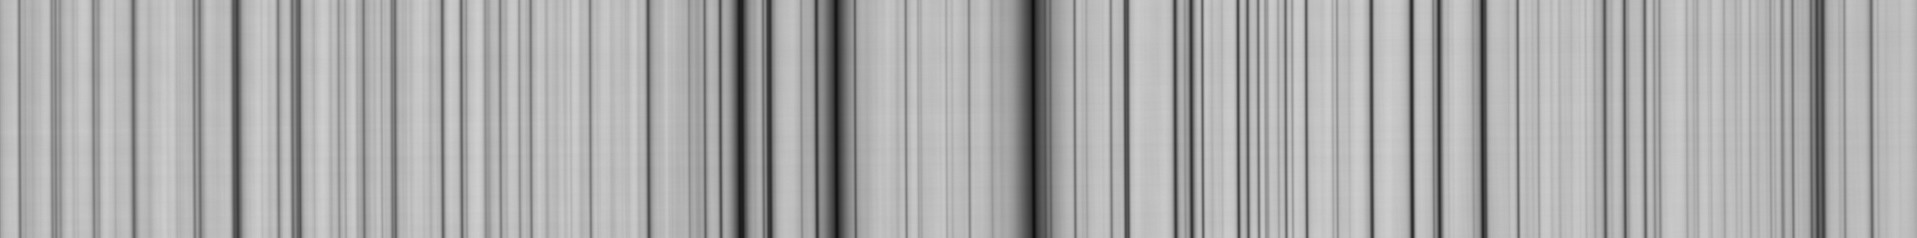
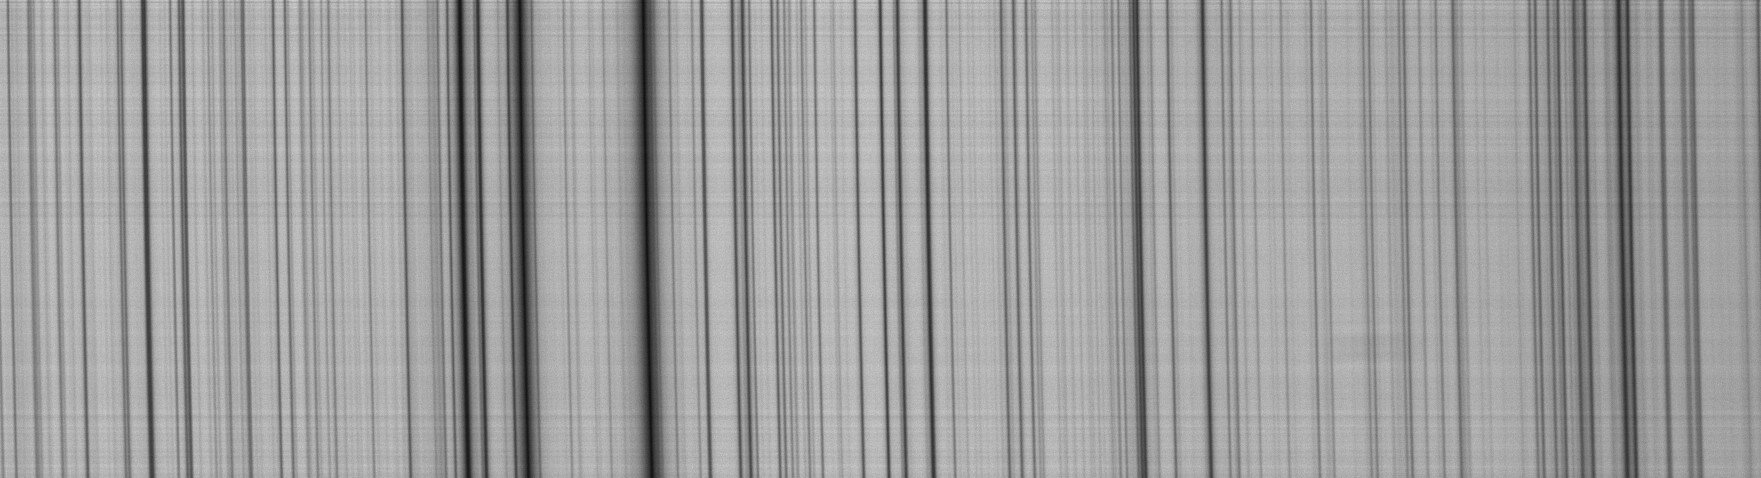
Ha line
Sol'Ex V2 configuration: 10 micron slit, 200 mm f.l. collimating lens, 2400 l/mm grating, 200 mm f.l. imaging lens, ASI290:
Sol'Ex V0 configuration: 10 micron slit, 80 mm f.l. collimating lens, 2400 l/mm grating, 125 mm f.l. imaging lens, ASI290:
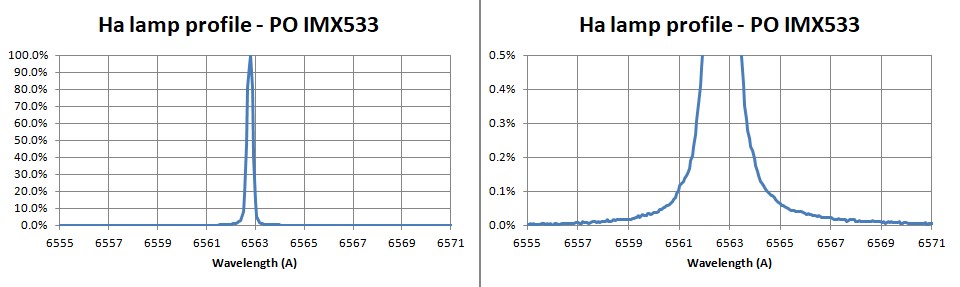
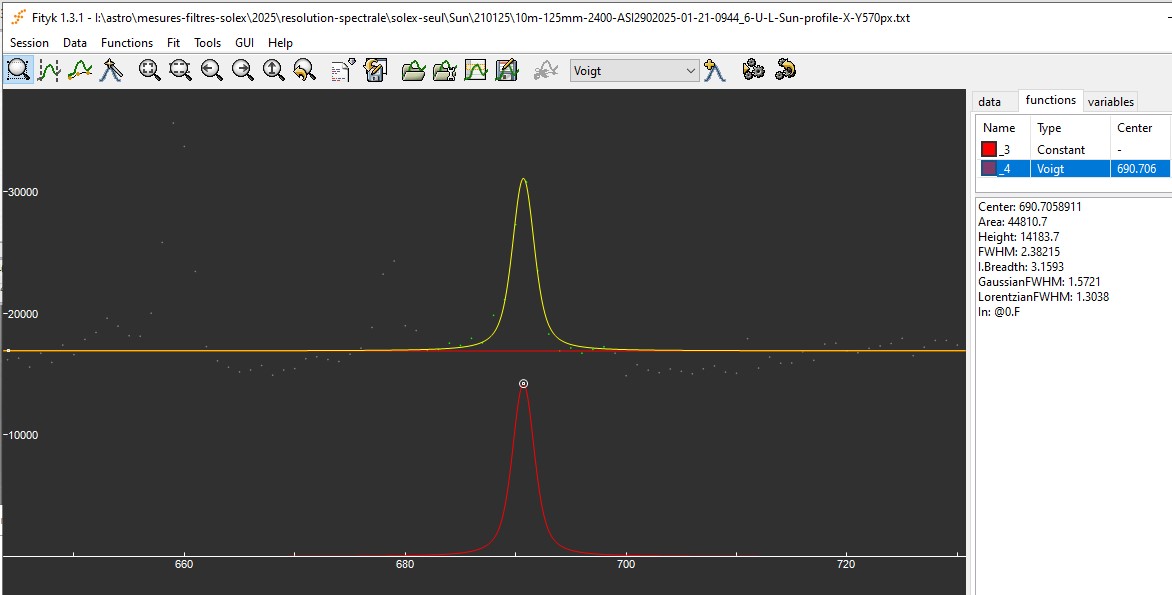
Measuring the linewidth of the Ha line of an hydrogen spectral lamp
One method for measuring the FWHM of
F-P etalon using interferometry is to use an hydrogen spectral lamp. Accordingly, it is
relevant to know how large is the linewidth of the Ha line provided by the
spectral lamp. Four measurements were done with Sol'Ex versions of increasing spectral resolution.
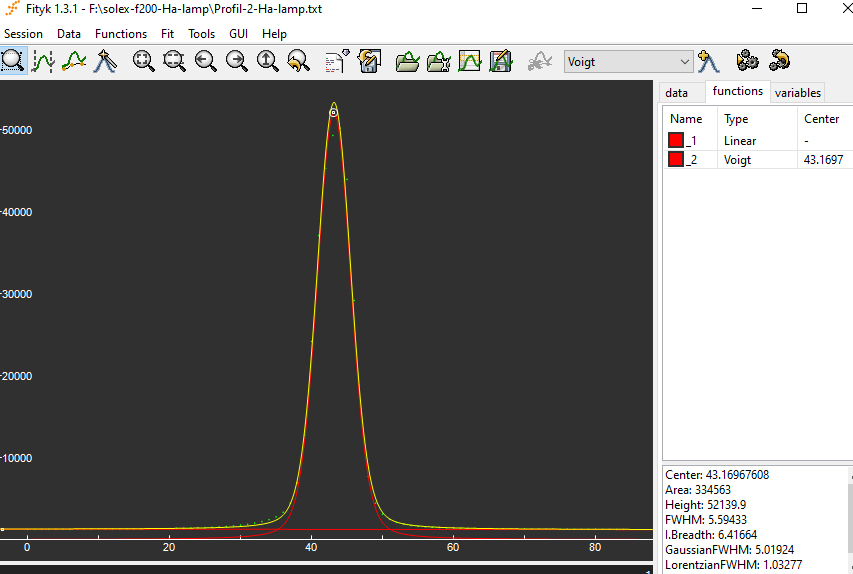
1) 80 mm collimator: Sol'Ex V0 configuration : 10 micron slit, 80 mm f.l. collimating lens, 2400 l/mm grating, 125 mm f.l. imaging lens, ASI290
Measured at 0.0753
A/pixel dispersion and curve-fitted with a Voigt function, the FWHM was found equal to 0.278 A.
Corrected from the theoritical spectral resolution of the SHG (0.22 A),
the deconvoluated FWHM of the lamp is : 0.17 A. The accuracy of
the measurement is limited since the measured FWHM is close to the
spectral resolution of the SHG.
2) 125 mm collimator: Sol'Ex V1 configuration : 10 micron slit, 125 mm f.l. collimating lens, 2400 l/mm grating, 125 mm f.l. imaging lens, ASI290
FWHM = 0.27 A
Corrected from the measured spectral resolution of the SHG (0.175 A),
the deconvoluated FWHM of the lamp is : 0.206 A.
3) 125 mm collimator: SHG700 configuration : 10 micron slit, 125 mm f.l. collimating lens, 2400 l/mm grating, 200 mm f.l. imaging lens, IMX585
measured FWHM = 0.264 A
Corrected from the measured spectral resolution of the SHG (0.155 A),
the deconvoluated FWHM of the lamp is : 0.214 A.
3) 200 mm collimator: Sol'Ex V1 configuration : 10 micron slit, 200 mm f.l. collimating lens, 2400 l/mm grating, 200 mm f.l. imaging lens, ASI290
FWHM = 0.263 A
Corrected from the measured spectral resolution of the SHG (0.155 A),
the deconvoluated FWHM of the lamp is : 0.214 A.
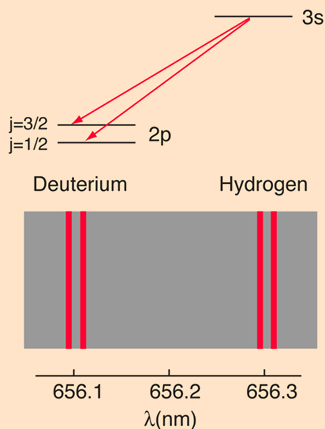
4) Comments on the width of the Ha line
The "large" FWHM of the Ha line of hydrogen lamp is probably partly
explained by the fine structure of hydrogen atom. Indeed, the Ha
line is a closely-spaced doublet (0.16 A).
Source : http://hyperphysics.phy-astr.gsu.edu/hbase/quantum/hydfin.html#c1
5) Accordingly, the FWHM of the etalons measured with the hydrogen lamp should
be corrected by the FWHM of the Ha line of the discharge lamp.
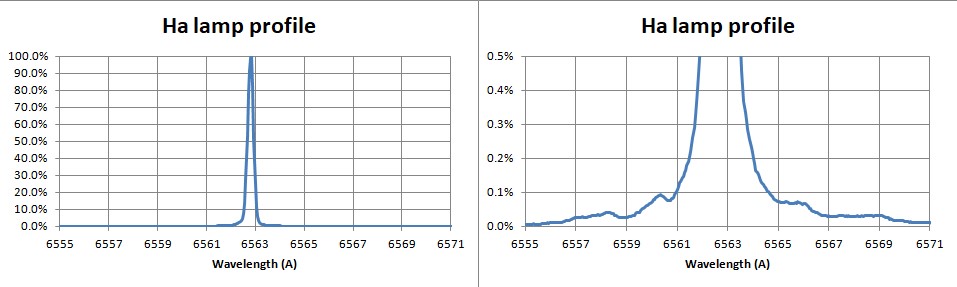
Test with the hydrogen discharge lamp
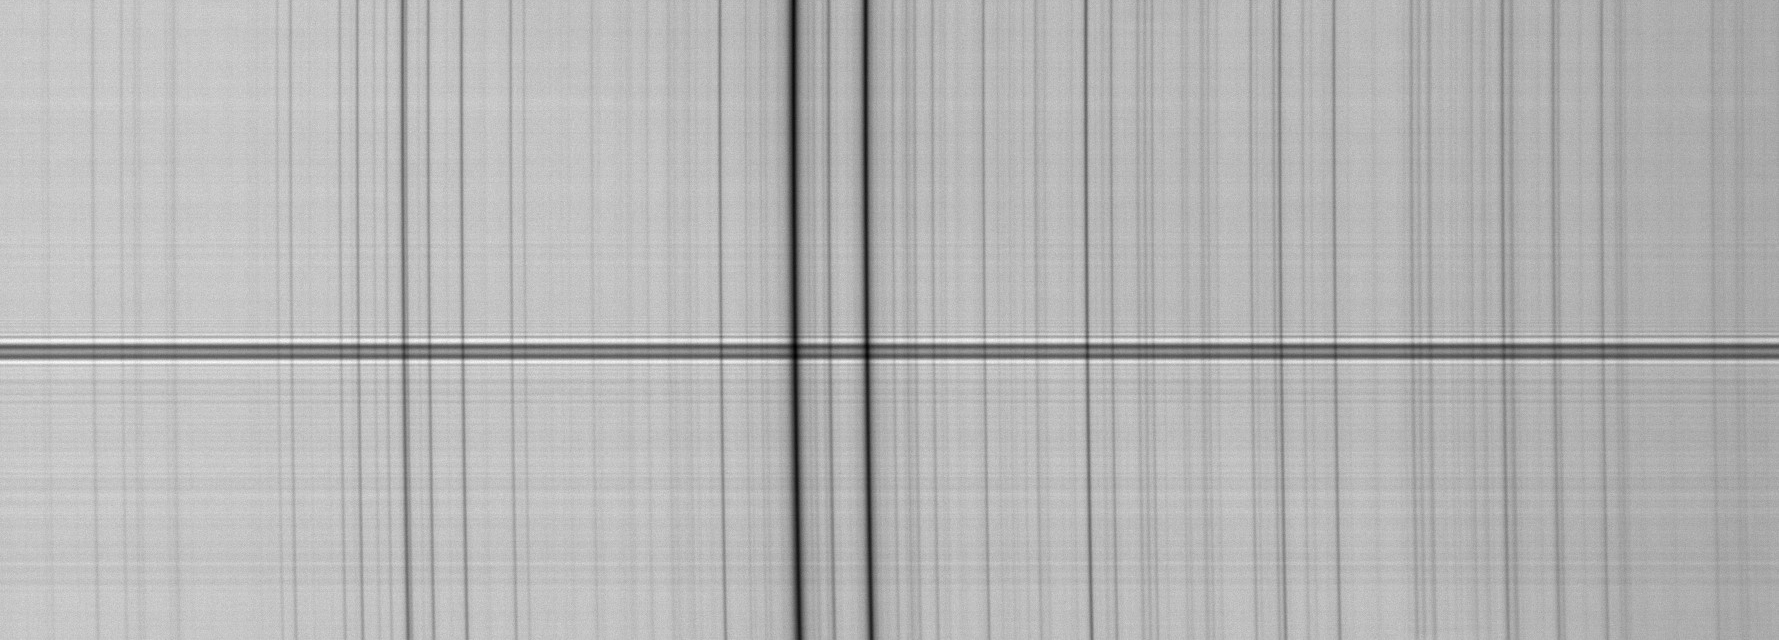
Interference fringes pattern developping in the cover slit of the sensor
In a nutshell : interference fringes are a nuisance
for the measuring of narrow band filters (< 0.8 A), specially in Ha
and when using the version of Sol'Ex with 200 mm collimating lens.
This is less an issue in Ca K (even with the 200 mm collimating lens).
Interference fringes develop most probably in the cover slit of the
sensor : nearly coherent light, very narrow FWHM and collimated
beam.
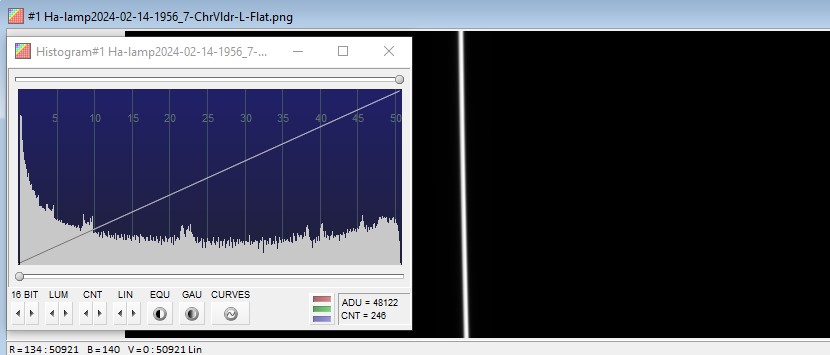
There fringes are significant on ASI290 and 462, with an amplitude of
about 0.05% on the input signal, while they are non measurable on
Player One Saturn M (IMX 533).
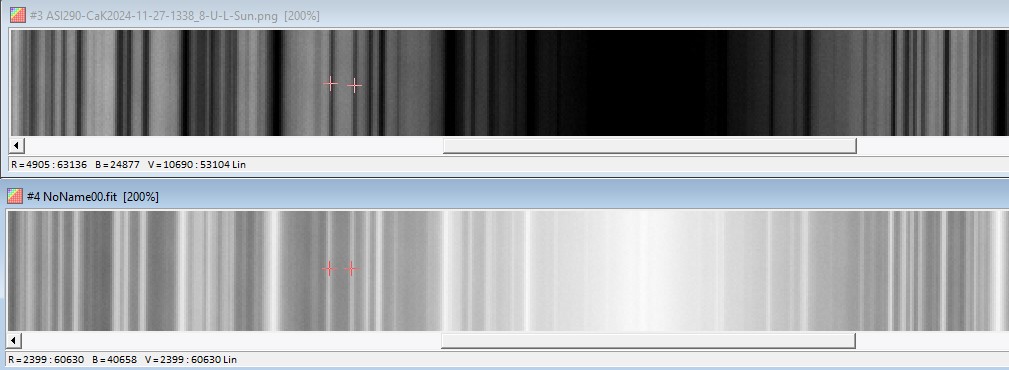
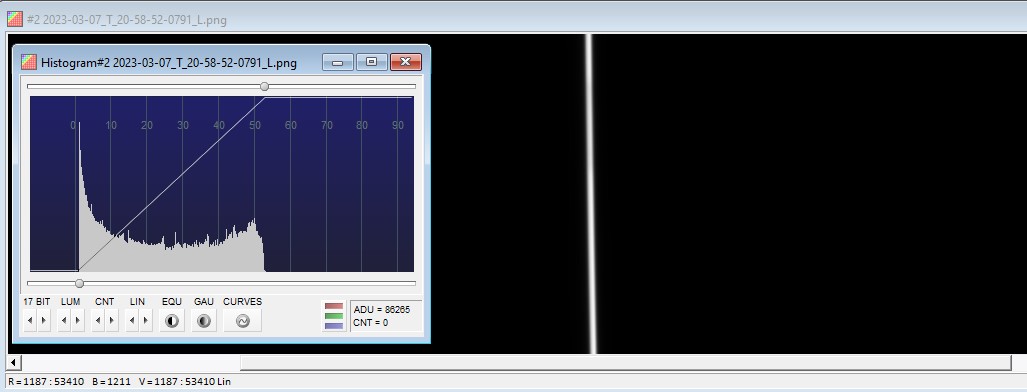
1- ASI290
Linear visualisation from min to max ADU:
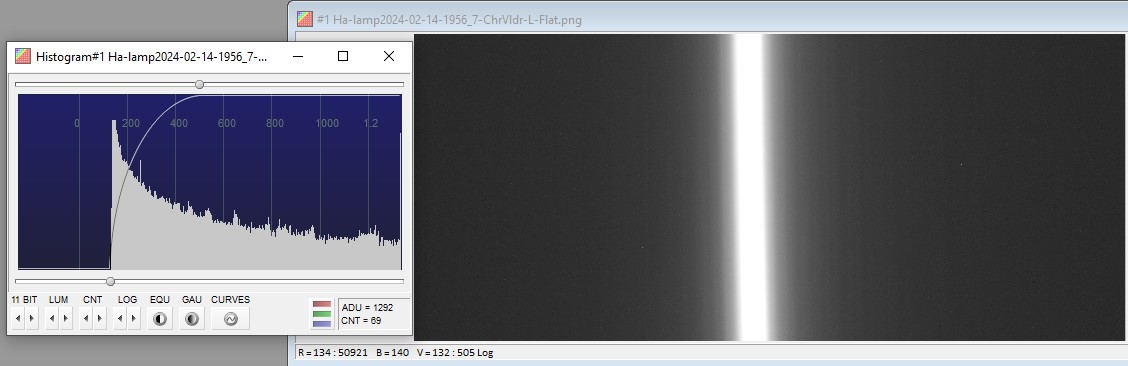
Log visualisation. The vertical fringe pattern is not the feet
of the Airy function (i.e. diffraction from the spectro slit) but an
interference pattern
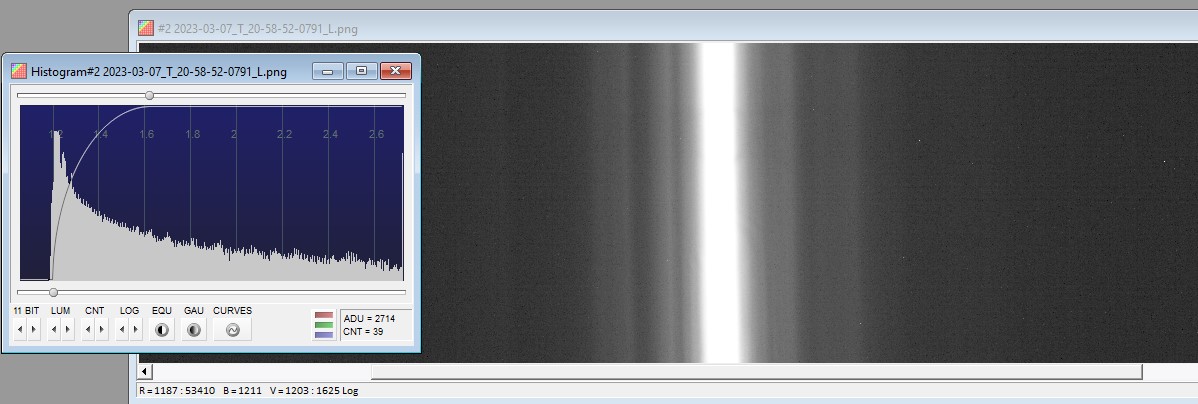
The amplitude of the inteference fringes is about 0.05% of the input signal:
Return to narrowband filters test
Return to solar page
Return
to home page