The filter was measured using different approaches:
- Ha lamp (using the filter as a Fabry-Perot interferometer),
- Sol'Ex spectrometer in collimated beam (f/115 beam) with two different sensors (IMX462 and IMX533),
- Sol'Ex spectrometer in telecentric beam (f/29.4 beam) with three different sensors (IMX290, IMX462, IMX533) and two different spectral resolution.
| Filter | Test method | f-ratio | Surface sampled | FSR | FWHM | Notes |
| Solar Spectrum 0.3 A | Ha lamp | Full aperture (1.5") |
0.8 to 0.9A |
|||
| Sol'Ex spectro (125 mm f.l. collimating and imaging lenses) |
f-29 telecentric | 10 micron × 4.5 mm | 0.75 to 0.82 A (consistent with 0.6 A in collimated beam) |
secondary peak of transmission | ||
| Sol'Ex spectro (200 mm f.l. collimating and imaging lenses) |
f-29 telecentric | 10 micron × 4.5 mm | 24.3 A | about 0.75 A (consistent with 0.6 A in collimated beam) |
||
| Sol'Ex spectro (200 mm f.l. collimating and imaging lenses) IMX533 |
f-115 | 10 micron × 4.5 mm | 0.50 A |
|||
| Sol'Ex spectro (200 mm f.l. collimating and imaging lenses) ASI462 |
f-115 | 10 micron × 4.5 mm | 24.4 A | 0.47 to 0.50 A |
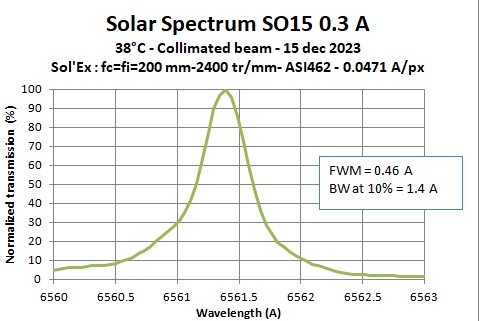
Conclusion :
- FWHM is in the range of 0.50 A in collimated beam.
- observation of a secondary peak transmission may mean there is some leakage in the polarizer ?
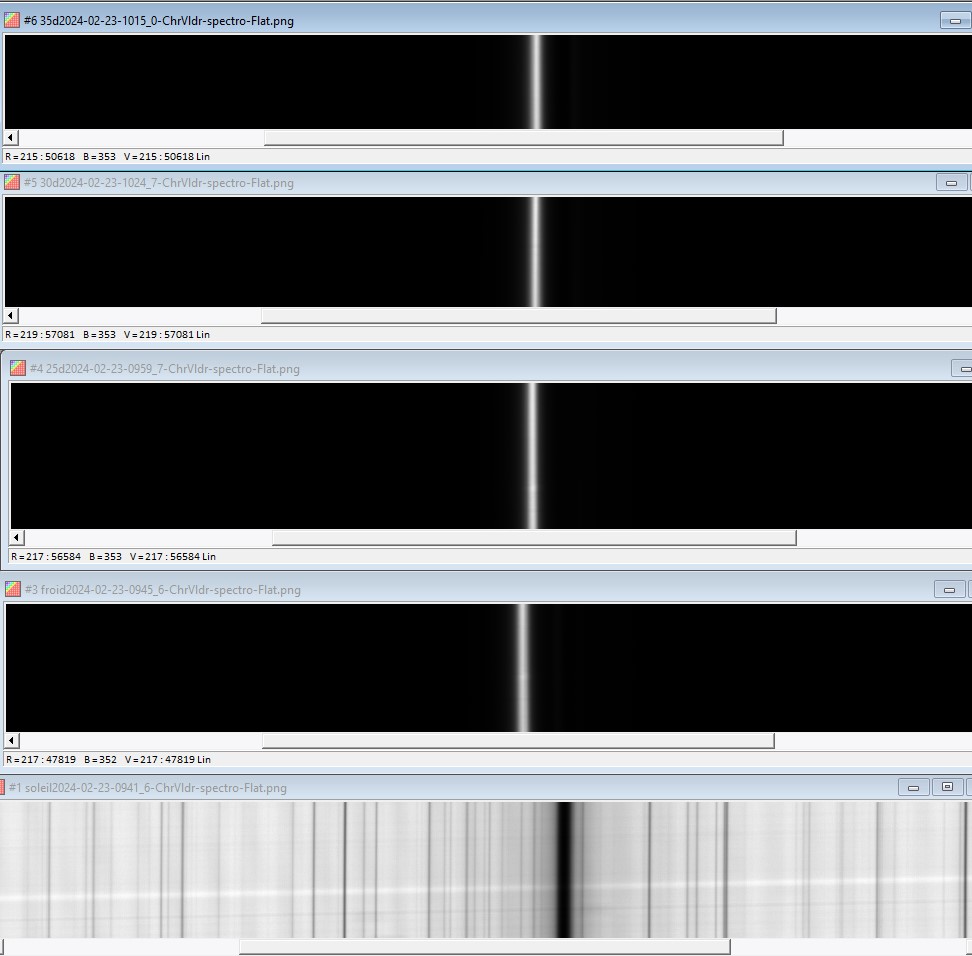
1) Measurement in a telecentric beam (f/29.3)
Optical setup: Sun => Takahashi TOA 150 => TZ-4 => Solar Spectrum 0.3A => Sol'Ex => ASI462
Sol'Ex spectrograph V1 : 10 microns slit, 125 mm collimating lens, 125 mm imaging lens, 2400 tr/mm, ASI462 camera, 12-bit acquisition.
Measured dispersion = 0.0757 A/pixel
Some thin cirrus - Low altitude Sun
23 Feb 2024
Transmitted spectra (from top to bottom : 35°C, 30°C, 25°C, 12°C, solar spectrum) - Linear visualisation
Transmitted spectra (from top to bottom : 35°C, 30°C, 25°C, 12°C, solar spectrum) - Log visualisation
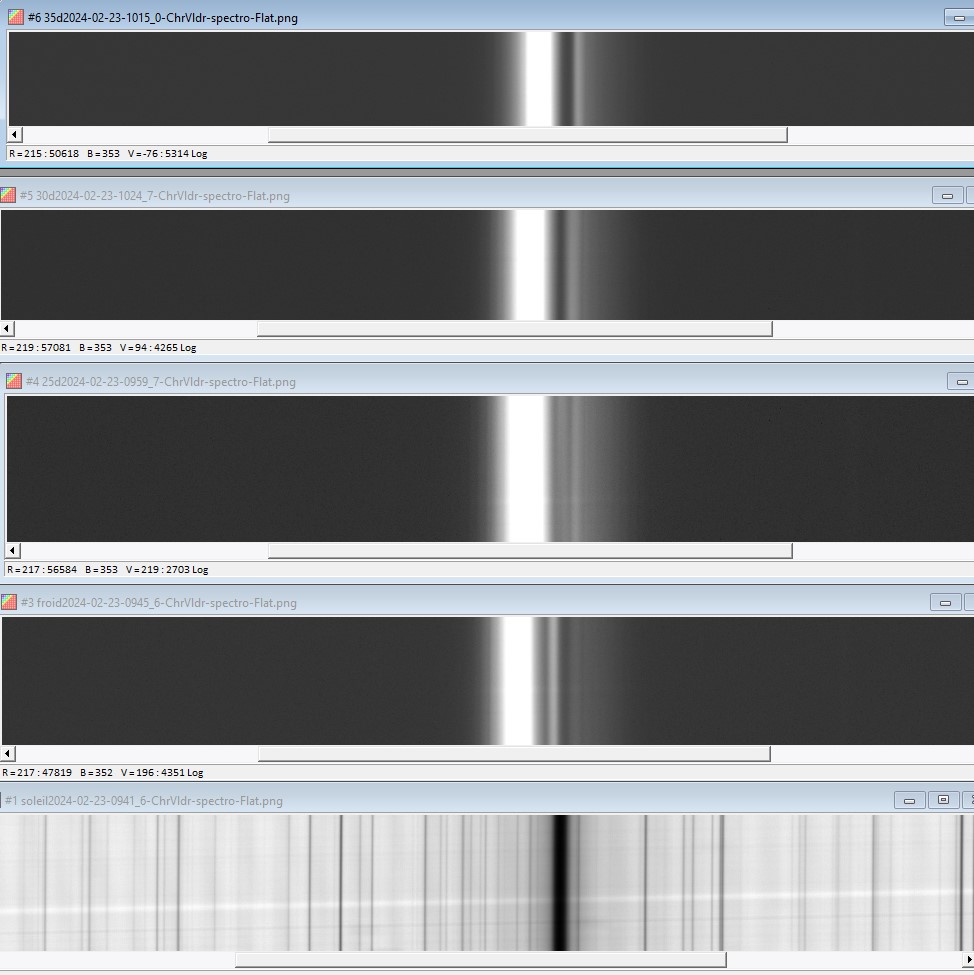
FWHM was measured at different etalon temperatures (12°C, 25°C, 30°C and 35°C).
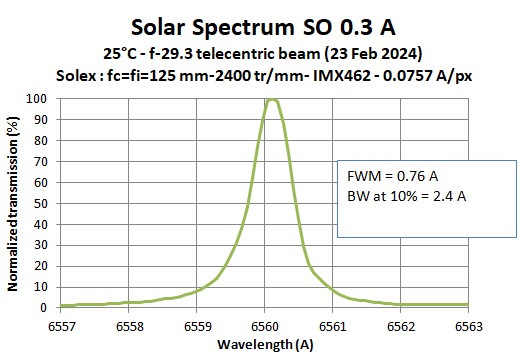
Measured values of FWHM ranges from 0.75 A to 0.82 A.
1b) Measurement in a telecentric beam (f/29.3)
Optical setup: Sun => Takahashi TOA 150 => TZ-4 => Solar Spectrum 0.3A => Sol'Ex => ASI290
Sol'Ex spectrograph V1 : 10 microns slit, 125 mm collimating lens, 125 mm imaging lens, 2400 tr/mm, ASI290 camera, 12-bit acquisition.
Measured dispersion = 0.0757 A/pixel
Blue sky
15 March 2024
Etalon regulated temperature = 57.5°C (very close to Ha centerline)

A secondary peak of transmssion is visible on the red side (right side) of the main peak of transmission. Tranmission is about 12% of main peak of transmission.
This is not an interference pattern coming from the camera since it is visible with other cameras, and not visible on etalons with similar FWHM. Maybe a leakage of the polarizing filter r ?
The secondary peak of transmission is more or less visible depending on the temperature of the etalon. It distors the transmission profile of the etalon and makes assessing the actual value of the FWHM more difficult.
This seems to be the case in particular when the CWL of the filter closer to Ha.
Here is an example at 62°C :

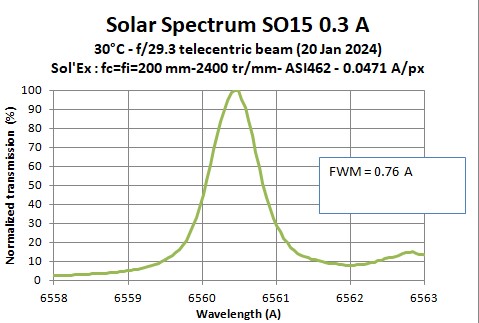
Optical setup: Sun => Takahashi TOA 150 => TZ-4 => Solar Spectrum 0.3A => Sol'Ex => ASI462
Sol'Ex spectrograph V2 : 10 microns slit, 200 mm collimating lens, 200 mm imaging lens, 2400 tr/mm, ASI462 camera, 12-bit acquisition.
Measured dispersion = 0.0471 A/pixel
Blue sky - Low altitude Sun
20 Jan 2024
Transmitted spectra for a 30°C etalon temperature (top : solar spectrum, middle : transmitted spectrum with log visualisation, bottom : transmitted spectrum with linea visualisation)
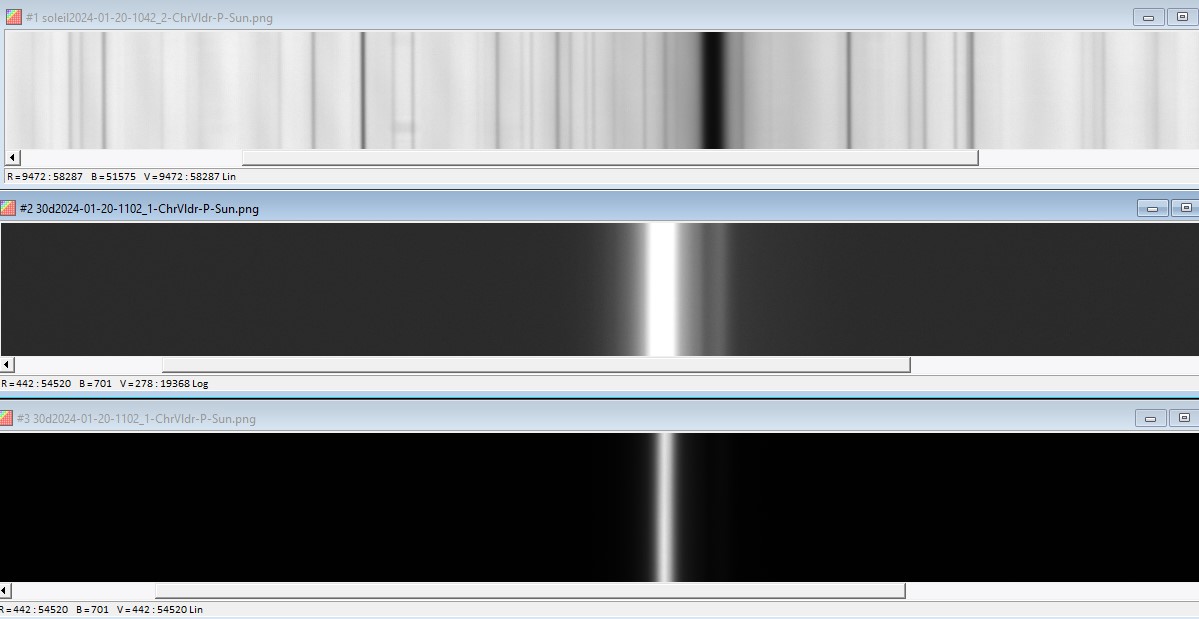
The rebound on the red side of the transmission profile is due to interference fringes forming in the cover slit of the camera. These interference fringes becomes more conspicious with the 200 mm f.l. collimating and imaging lenses.
Optical setup: Sun => Takahashi TOA 150 => TZ-4 => Solar Spectrum 0.3A => Sol'Ex => ASI462
Sol'Ex spectrograph V1 : 10 microns slit, 125 mm collimating lens, 125 mm imaging lens, 2400 tr/mm, ASI462 camera, 12-bit acquisition.
Measured dispersion = 0.0757 A/pixel
Some thin cirrus - Low altitude Sun
23 Feb 2024
Transmitted spectra (from top to bottom : 35°C, 30°C, 25°C, 12°C, solar spectrum) - Linear visualisation
Transmitted spectra (from top to bottom : 35°C, 30°C, 25°C, 12°C, solar spectrum) - Log visualisation
FWHM was measured at different etalon temperatures (12°C, 25°C, 30°C and 35°C).
Measured values of FWHM ranges from 0.75 A to 0.82 A.
1b) Measurement in a telecentric beam (f/29.3)
Optical setup: Sun => Takahashi TOA 150 => TZ-4 => Solar Spectrum 0.3A => Sol'Ex => ASI290
Sol'Ex spectrograph V1 : 10 microns slit, 125 mm collimating lens, 125 mm imaging lens, 2400 tr/mm, ASI290 camera, 12-bit acquisition.
Measured dispersion = 0.0757 A/pixel
Blue sky
15 March 2024
Etalon regulated temperature = 57.5°C (very close to Ha centerline)
The three following spectra are all aligned along the lambda axis :
- transmitted spectrum at 57.5°C,
- solar spectrum (without any filter),
- transmitted spectrum at 57.5 C (same as above) but with different thresholds of visualisation.
- transmitted spectrum at 57.5°C,
- solar spectrum (without any filter),
- transmitted spectrum at 57.5 C (same as above) but with different thresholds of visualisation.
A secondary peak of transmssion is visible on the red side (right side) of the main peak of transmission. Tranmission is about 12% of main peak of transmission.
This is not an interference pattern coming from the camera since it is visible with other cameras, and not visible on etalons with similar FWHM. Maybe a leakage of the polarizing filter r ?
The secondary peak of transmission is more or less visible depending on the temperature of the etalon. It distors the transmission profile of the etalon and makes assessing the actual value of the FWHM more difficult.
This seems to be the case in particular when the CWL of the filter closer to Ha.
Here is an example at 62°C :
Optical setup: Sun => Takahashi TOA 150 => TZ-4 => Solar Spectrum 0.3A => Sol'Ex => ASI462
Sol'Ex spectrograph V2 : 10 microns slit, 200 mm collimating lens, 200 mm imaging lens, 2400 tr/mm, ASI462 camera, 12-bit acquisition.
Measured dispersion = 0.0471 A/pixel
Blue sky - Low altitude Sun
20 Jan 2024
Transmitted spectra for a 30°C etalon temperature (top : solar spectrum, middle : transmitted spectrum with log visualisation, bottom : transmitted spectrum with linea visualisation)
The rebound on the red side of the transmission profile is due to interference fringes forming in the cover slit of the camera. These interference fringes becomes more conspicious with the 200 mm f.l. collimating and imaging lenses.
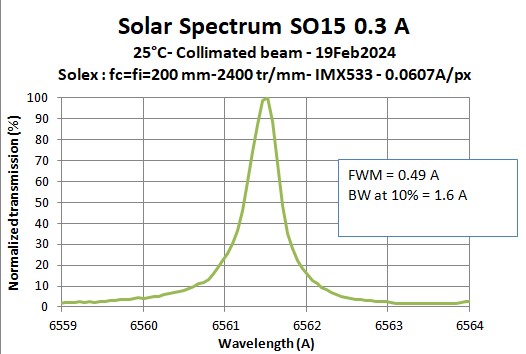
2) Measurement in a collimated beam (f/115)
Optical setup: Sun => Solar Spectrum 0.3A => Sol'Ex => ASI462
Sol'Ex spectrograph V2 : 10 microns slit, 200 mm collimating lens, 200 mm imaging lens, PO Saturn-M (IMX533) camera, 14-bit acquisition.
Spectral dispersion = 0.0607 A/pixel
Low altitude Sun
19 February 2024
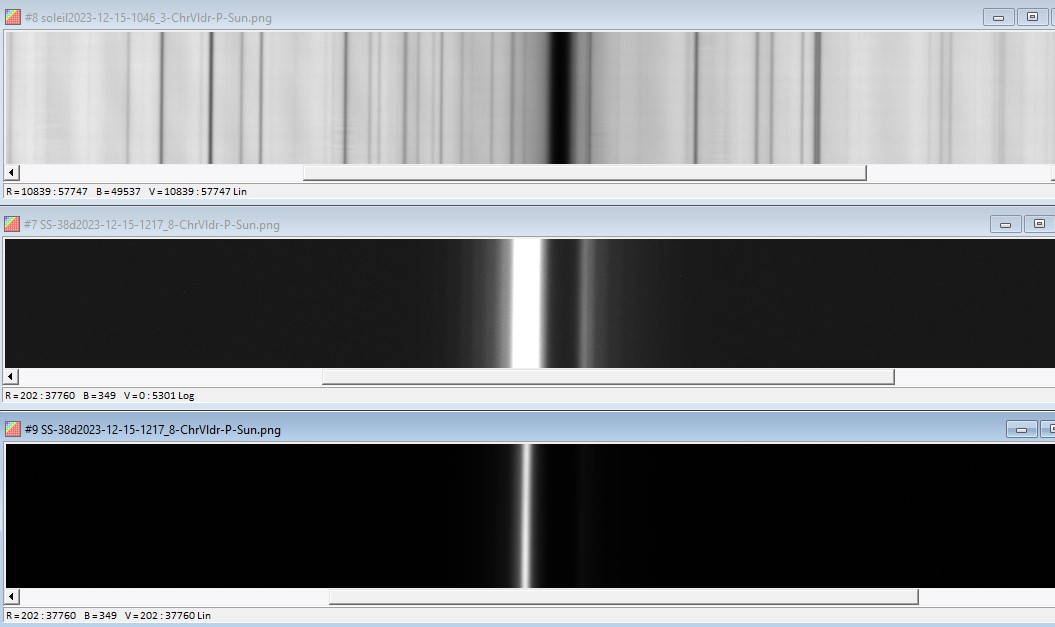
Optical setup: Sun => Solar Spectrum 0.3A => Sol'Ex => ASI462
Sol'Ex spectrograph V2 : 10 microns slit, 200 mm collimating lens, 200 mm imaging lens, ASI462 camera, 12-bit acquisition.
Measured dispersion = 0.0471 A/pixel
Blue sky - Low altitude Sun
5 Decembre 2023
Three succesive images :
- solar spectrum,
- solar spectrum transmitted by the Solar Spectrum 0.3A at 38°C. The spectrum is registered to the solar spectrum.
- solar spectrum,
- solar spectrum transmitted by the Solar Spectrum 0.3A at 38°C. The spectrum is registered to the solar spectrum.
3) Measurement with the Ha lamp (in diffuse light)
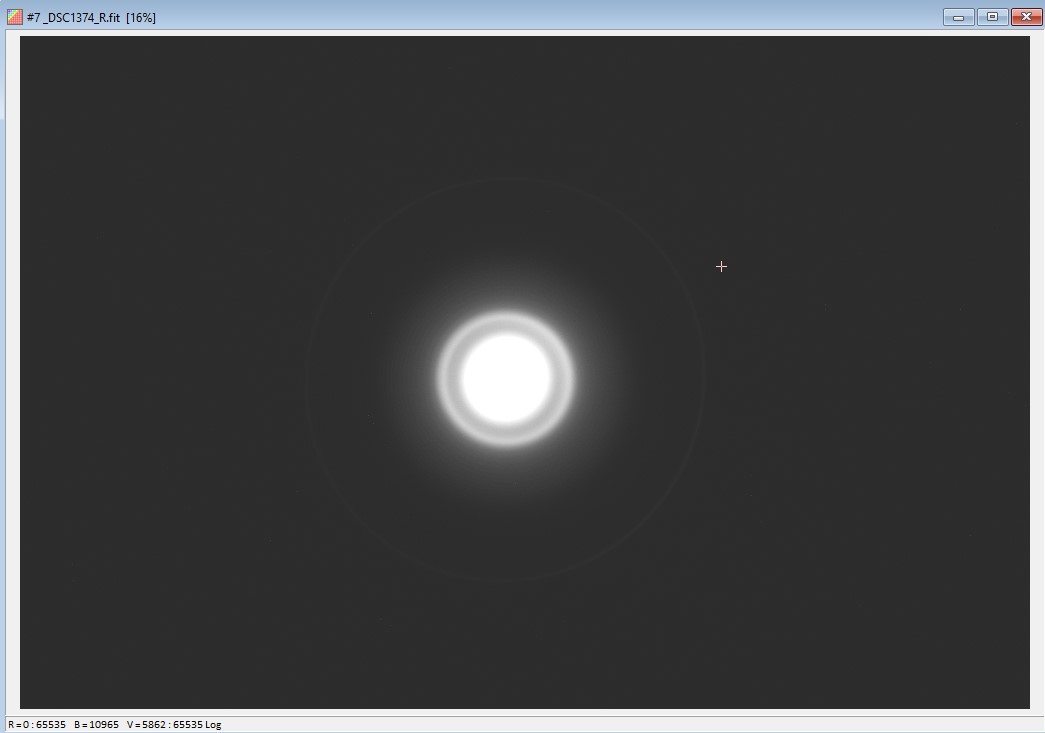
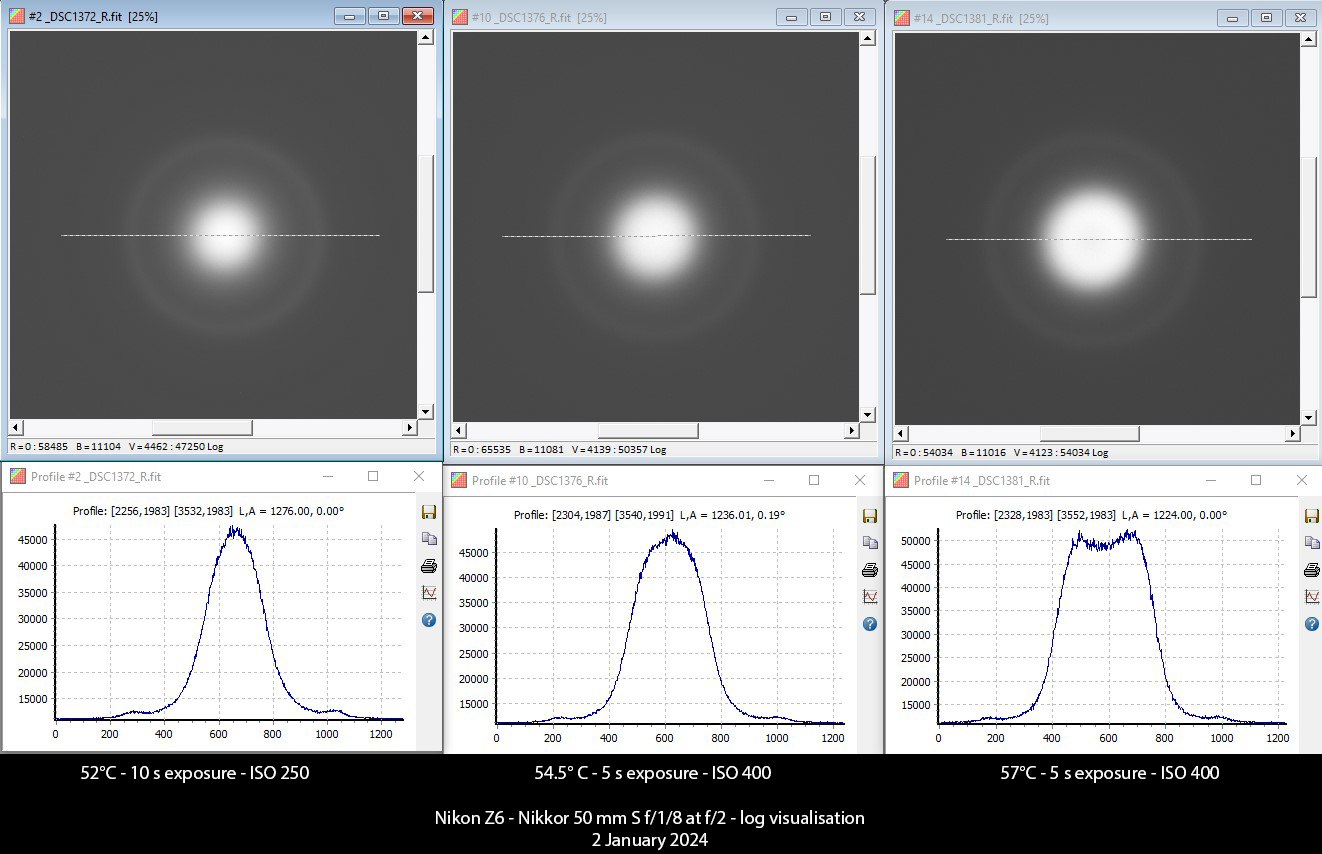
Nikkor 50 mm S f/1.8 at f/2 - Nikon Z6 - 1000 ISO - 60 s exposure - 12 bits - Raw mode (2 jan 2024)
FWHM measured over the full aperture of the filter = between 0.8 and 0.9 A
Note the bright secondary peak of transmission (= fringe) very close to the center of the interference pattern. This suggest/confirm a possible leakage of the polarizising filter.
The actual (and normal) fringe #2 has a much larger diameter and is much fainter (see left from the cross).
Temperature tuning with the Ha lamp (in collimated beam)
Reference temperature in collimated beam
The following two figures show the evolution of the interference pattern from 52°C to 57°C.
The name plate reference temperature of the etalon is 57°C. Still, the CWL is on Ha at 52°C (in a collimated beam).
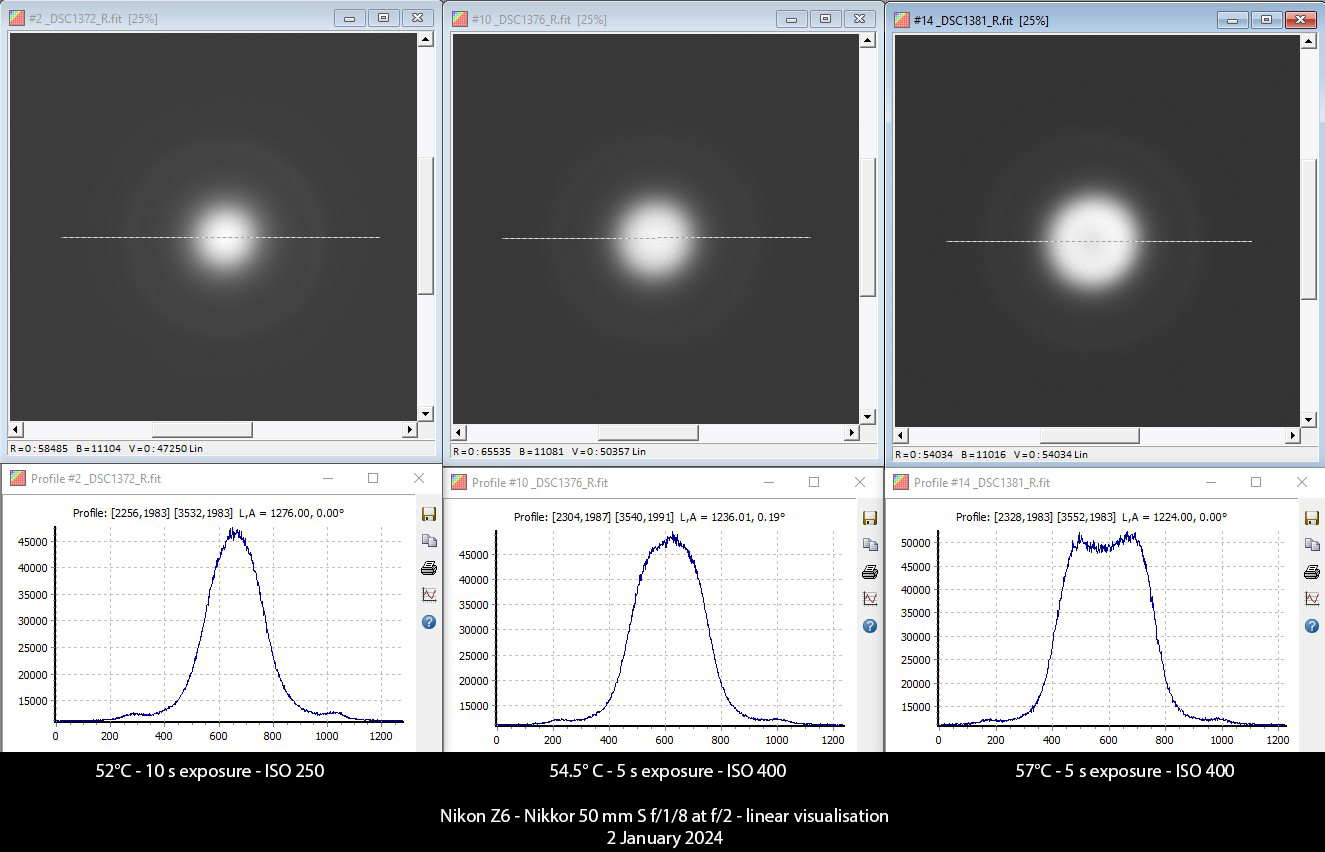