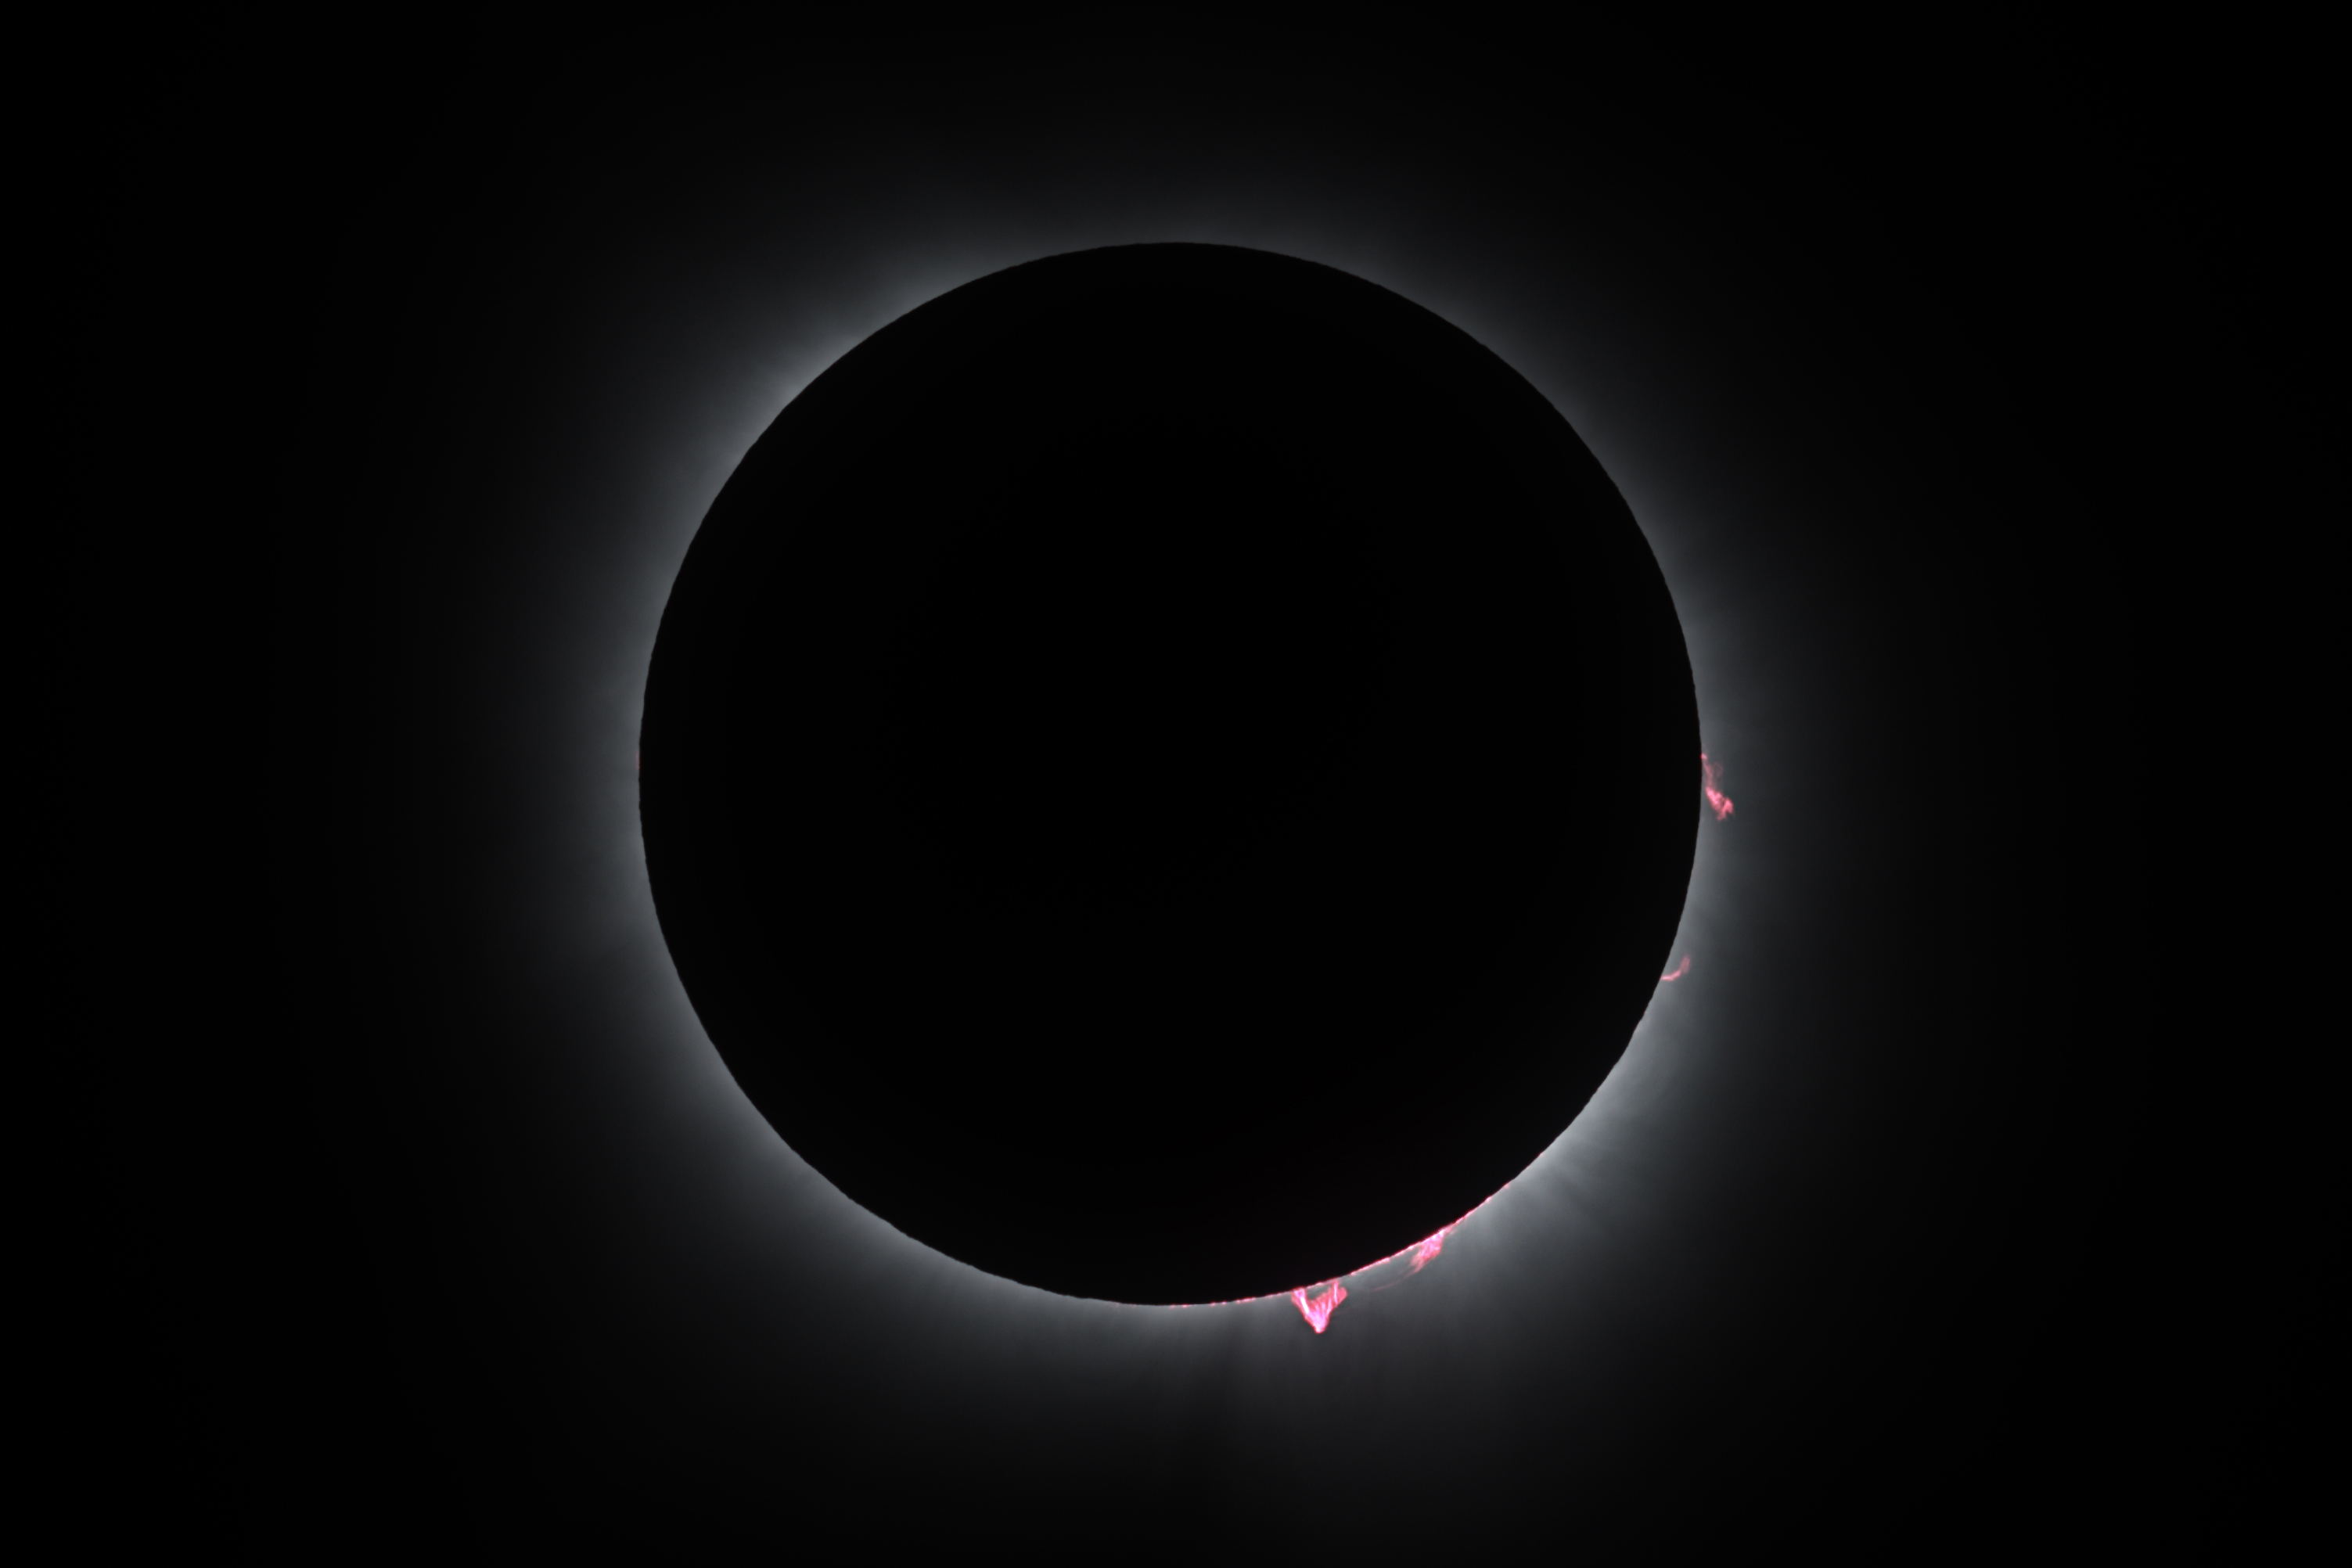
8 April 2024
Cacalotan - Mexico
Local circumstances
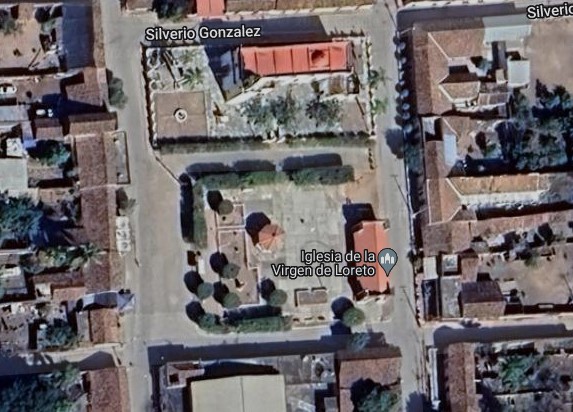
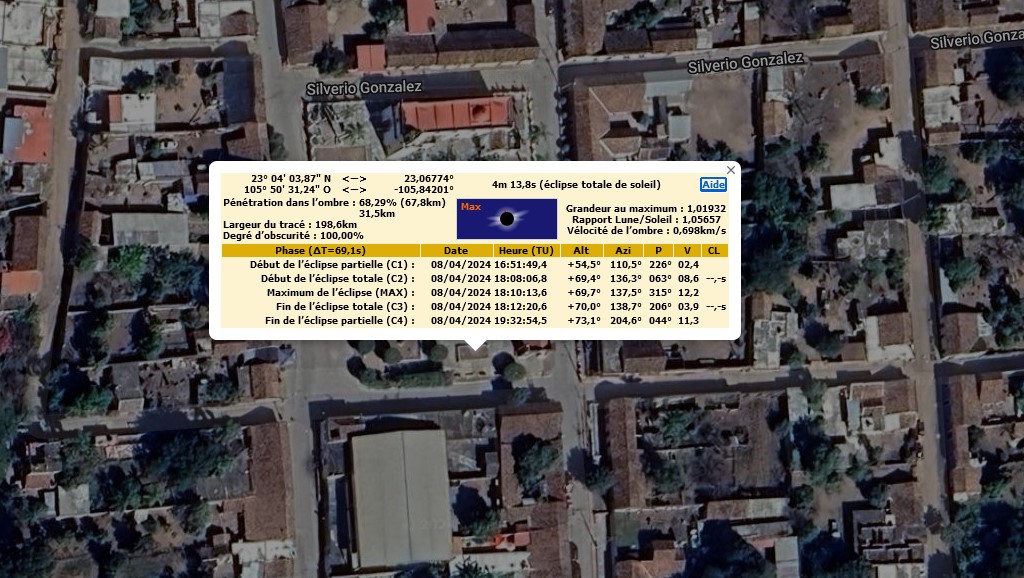
Location : North +23° 04' 03.87", West 105° 50' 31.24"
Duration of totality : 4mn 14s
Conditions of observation
Equipement :
ZWO FF 80/600 refractor (continuous check of focus up to about 5 min before totality).
Nikon Z7II, 14-bit RAW mode (non destructive compression),
electronic shutter mode. Pixel size = 4.35 micron. Image
scale = 1.5 arsec/pixel
Exposure times for totality : 1s to 1/250 s (9 EV bracketing at 1 EV interval, 9 frames taken in burst mode at 3 s interval)
Mount : iOptron HAE29EC.
Seeing conditions : cirrus of variable thickness.
Estimation of the resolution :
Star FWHM measured on RAW images = 2.8 pixels (= 4.2 arsec).
1) Pre-processing
- flat/offset correction,
- hot pixels correction (home-made Julia code).
2) Registration of the image on solar corona
- registration of images on solar corona using zdeta Psc (mag 5.2) position (measured to 0.1 pixel) and correction of differential motion Sun/stars (based on ephemerids at local observation site).
3) HDR processing
- home made Julia software,
- calculation done in floating 64-bit, output fit file saved in 32-bit integer,
- image weight function = sinus function (except for 1 s and 1/250 s exposures),
- sensor response function is assumed to be linear (see measurement at the bottom of this page).
4) Display of HDR image
The basic idea is :
image_visu = HDR_image / [gaussian (HDR_image, sigma (r) + constant]
- r= distance from solar disk center,
- a large value sigma increases the visibility of long streamers and large scale structures away from the solar center (and decreases apparent noise in the resulting image),
- a small value of sigma is more appropriate to increase the constrast of small scale structures near the solar limb (and also reduces Gibb effet near the solar limb),
- the constant increases/lowers the effect of the gaussian mask.
The color images displayed here are the result of using a variable value of sigma (from 10 pixels to 30 pixels) as the distance r from the solar limb increases.
Link to a techical presentation about processing the eclipse images (in French)
Link to the Julia HDR code
Star FWHM measured on RAW images = 2.8 pixels (= 4.2 arsec).
Processing of the image of totality
1) Pre-processing
- flat/offset correction,
- hot pixels correction (home-made Julia code).
2) Registration of the image on solar corona
- registration of images on solar corona using zdeta Psc (mag 5.2) position (measured to 0.1 pixel) and correction of differential motion Sun/stars (based on ephemerids at local observation site).
3) HDR processing
- home made Julia software,
- calculation done in floating 64-bit, output fit file saved in 32-bit integer,
- image weight function = sinus function (except for 1 s and 1/250 s exposures),
- sensor response function is assumed to be linear (see measurement at the bottom of this page).
4) Display of HDR image
The basic idea is :
image_visu = HDR_image / [gaussian (HDR_image, sigma (r) + constant]
- r= distance from solar disk center,
- a large value sigma increases the visibility of long streamers and large scale structures away from the solar center (and decreases apparent noise in the resulting image),
- a small value of sigma is more appropriate to increase the constrast of small scale structures near the solar limb (and also reduces Gibb effet near the solar limb),
- the constant increases/lowers the effect of the gaussian mask.
The color images displayed here are the result of using a variable value of sigma (from 10 pixels to 30 pixels) as the distance r from the solar limb increases.
Link to a techical presentation about processing the eclipse images (in French)
Link to the Julia HDR code
Mid-exposure = 18:11:31 UT
9 x 9 exposures from 1/250 s to 1s (at 1 EV interval), total exposure = 18 s
Version 1
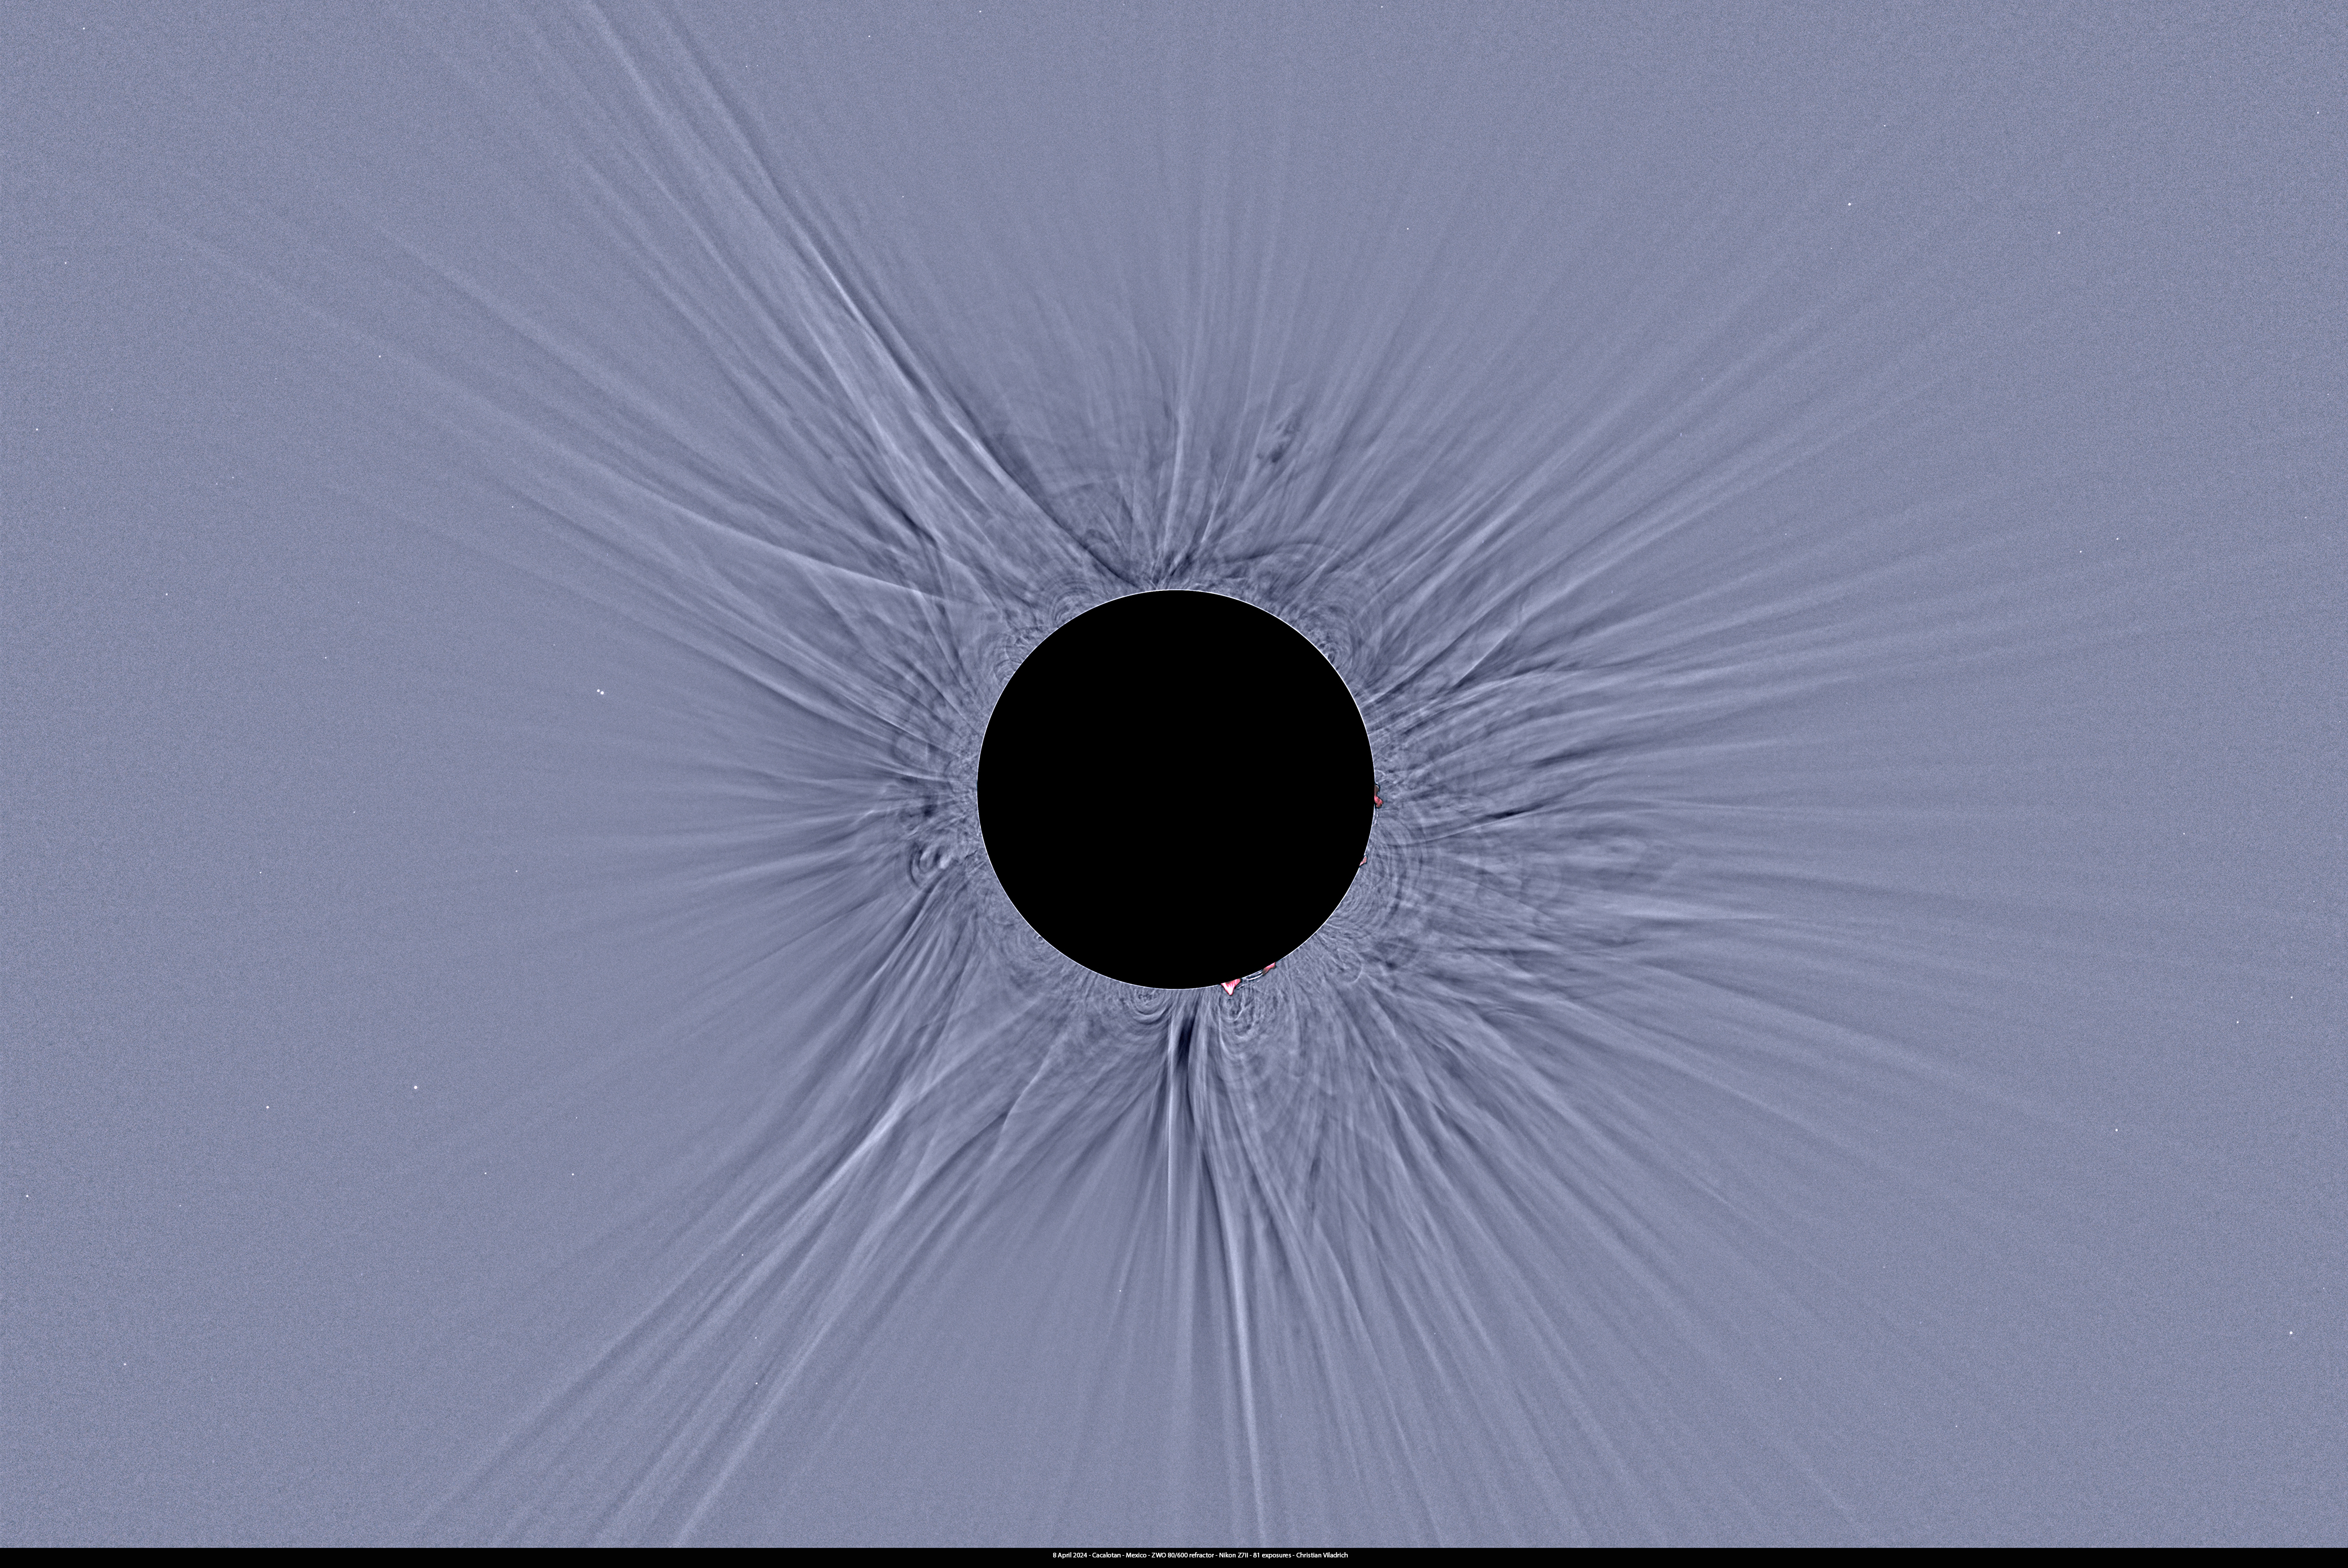
Link to full-resolution image
Stars are visible to mag 11.4
Version 2
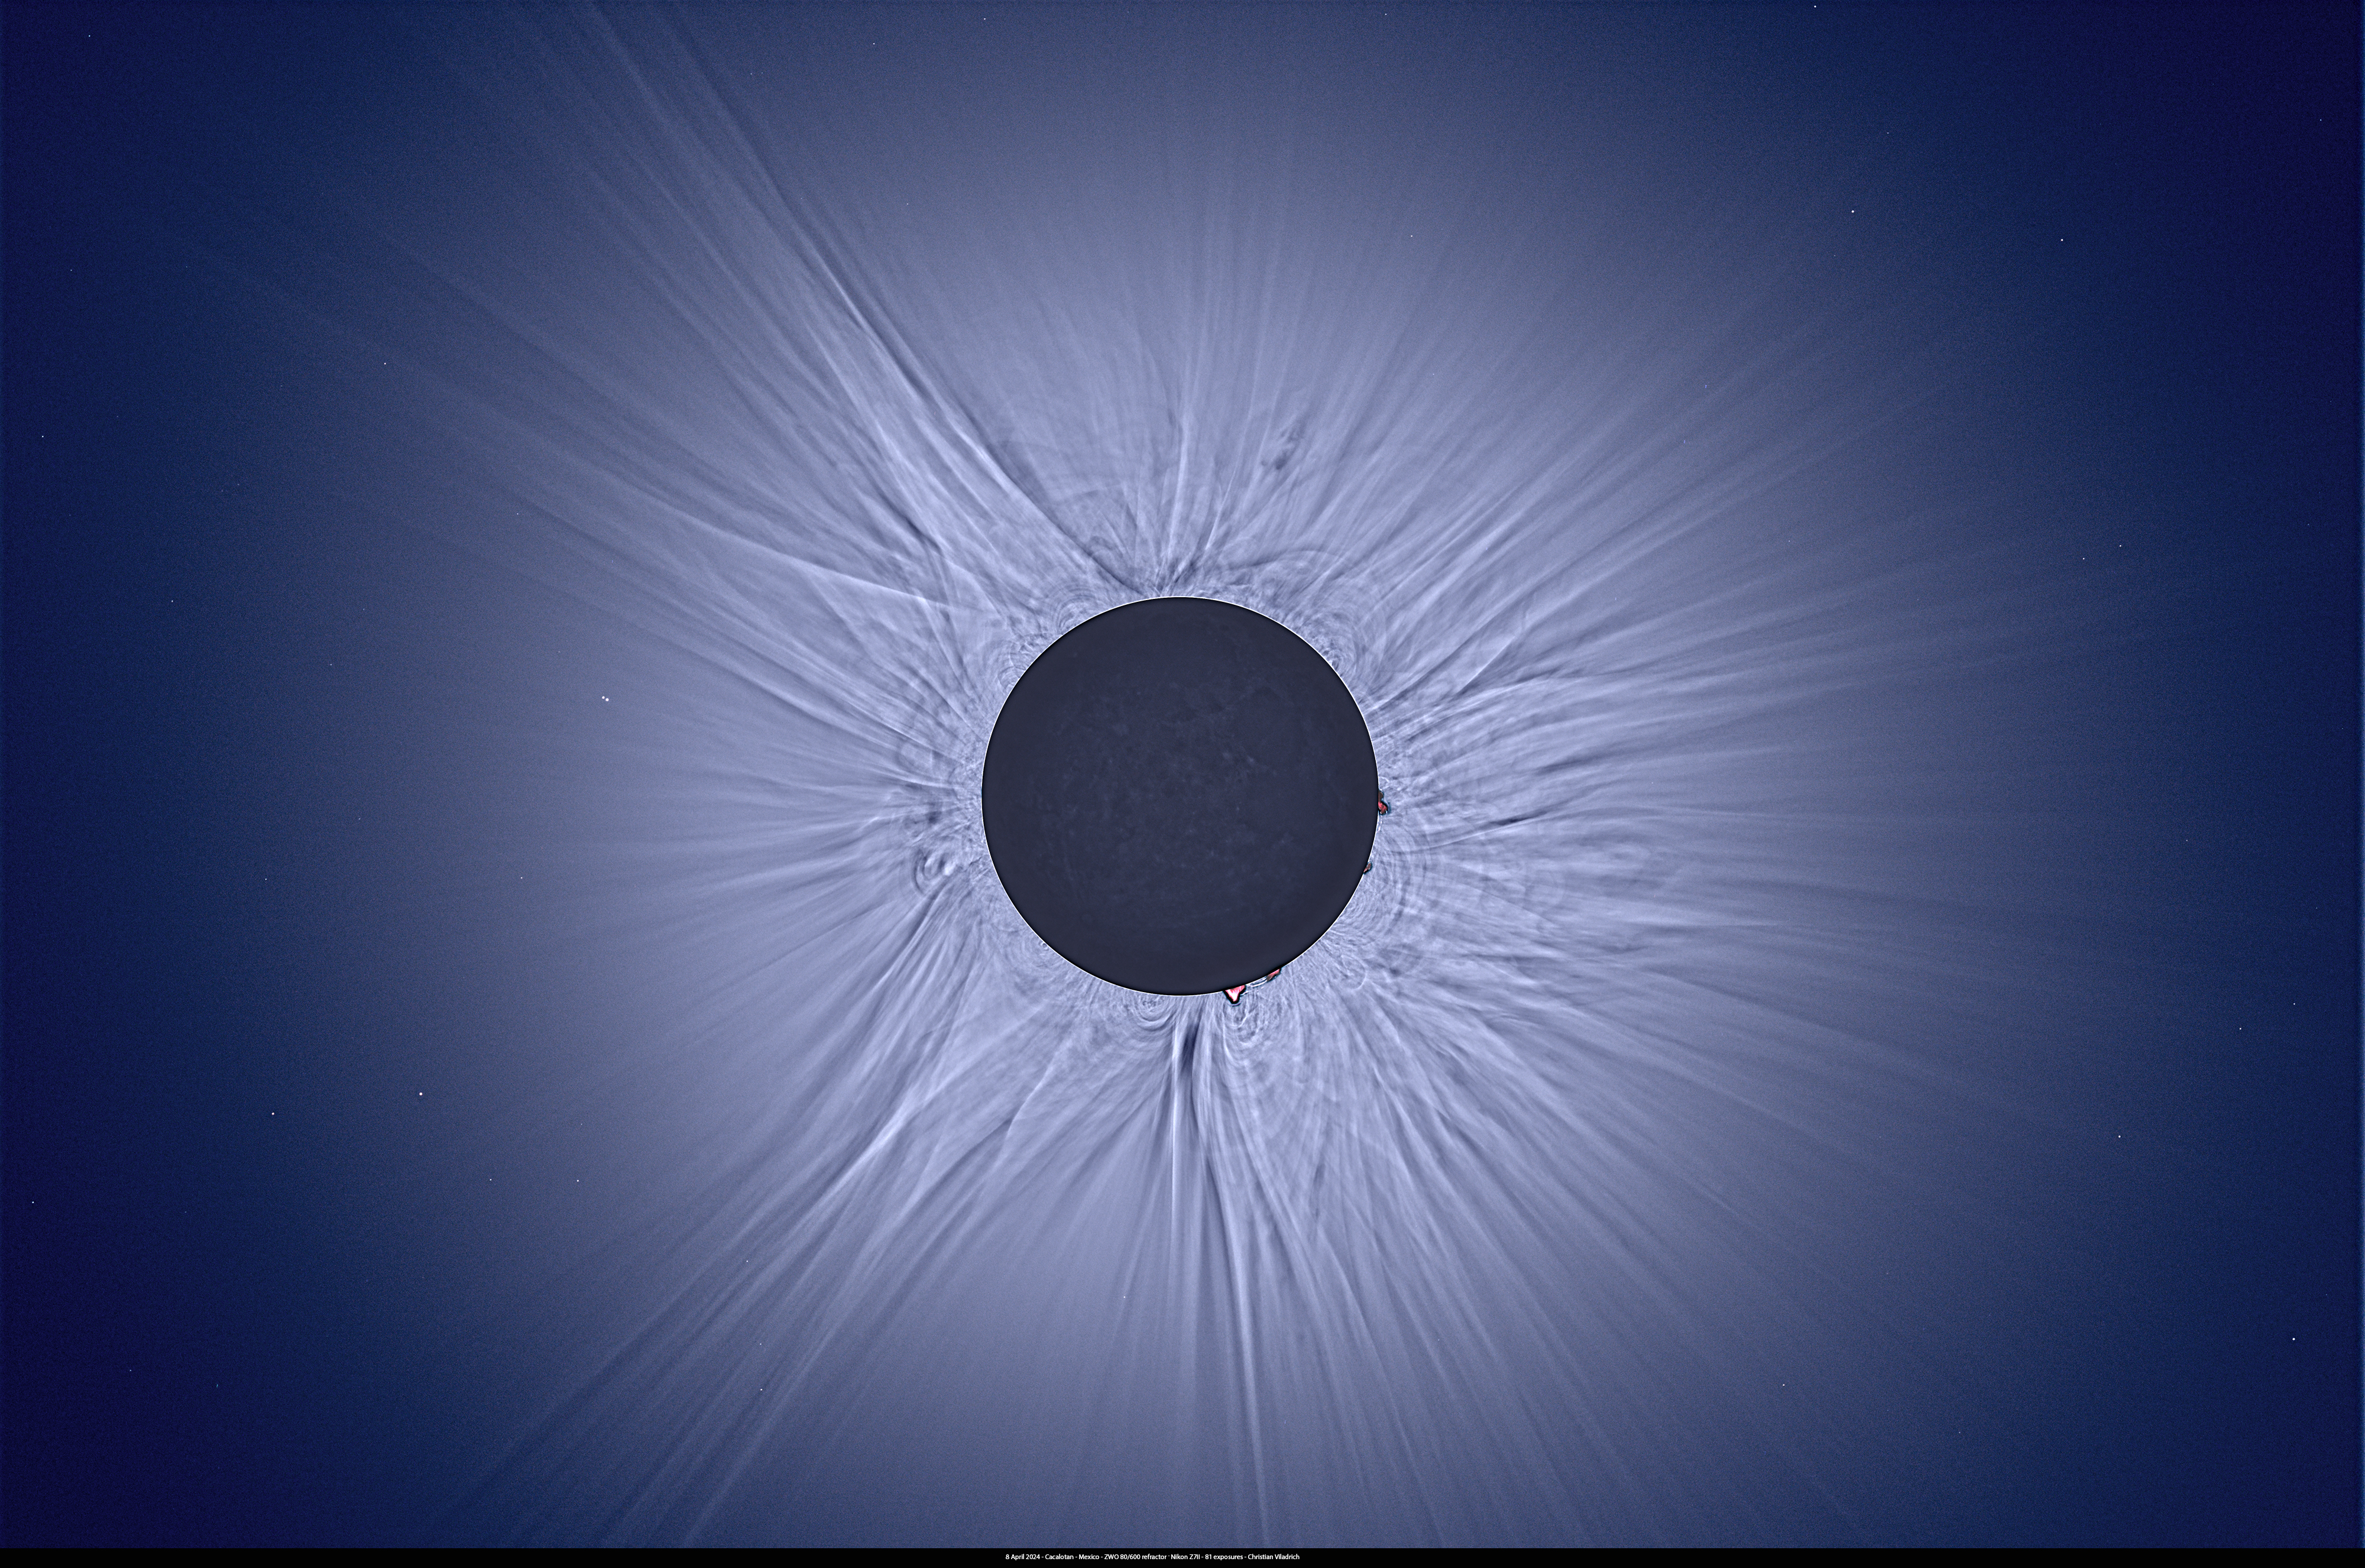
Link to full-resolution image
Motions in the solar corona
Blink of two HDR stacks taken on 18:08:37 UT and 18:11:45 UT (i.e. about 3 min apart)
Click on image for zoom 50% animation (7 Mo)
Click here for zoom 100% animation (35 Mo)
Notes :
- 1h and 5 h directions : dark voids going downward,,
- 11h, 9 h and 5 h directions : expanding streamers,
- 9 h direction : expanding bubble.
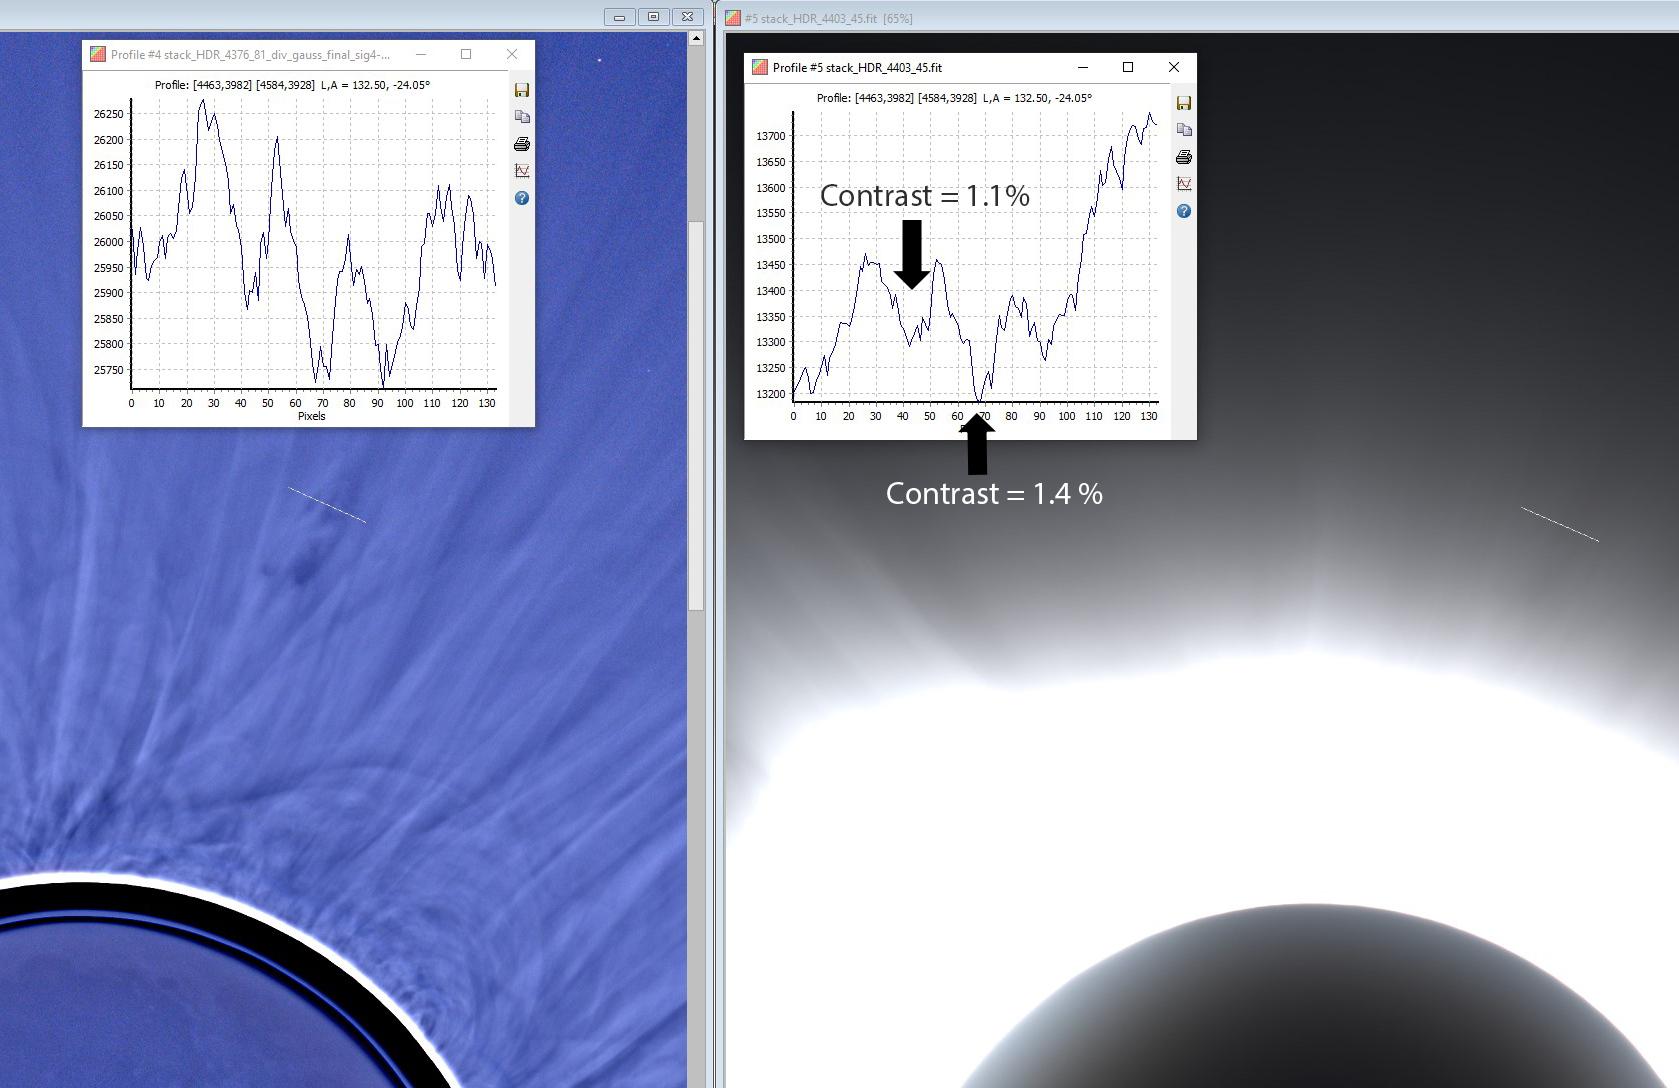
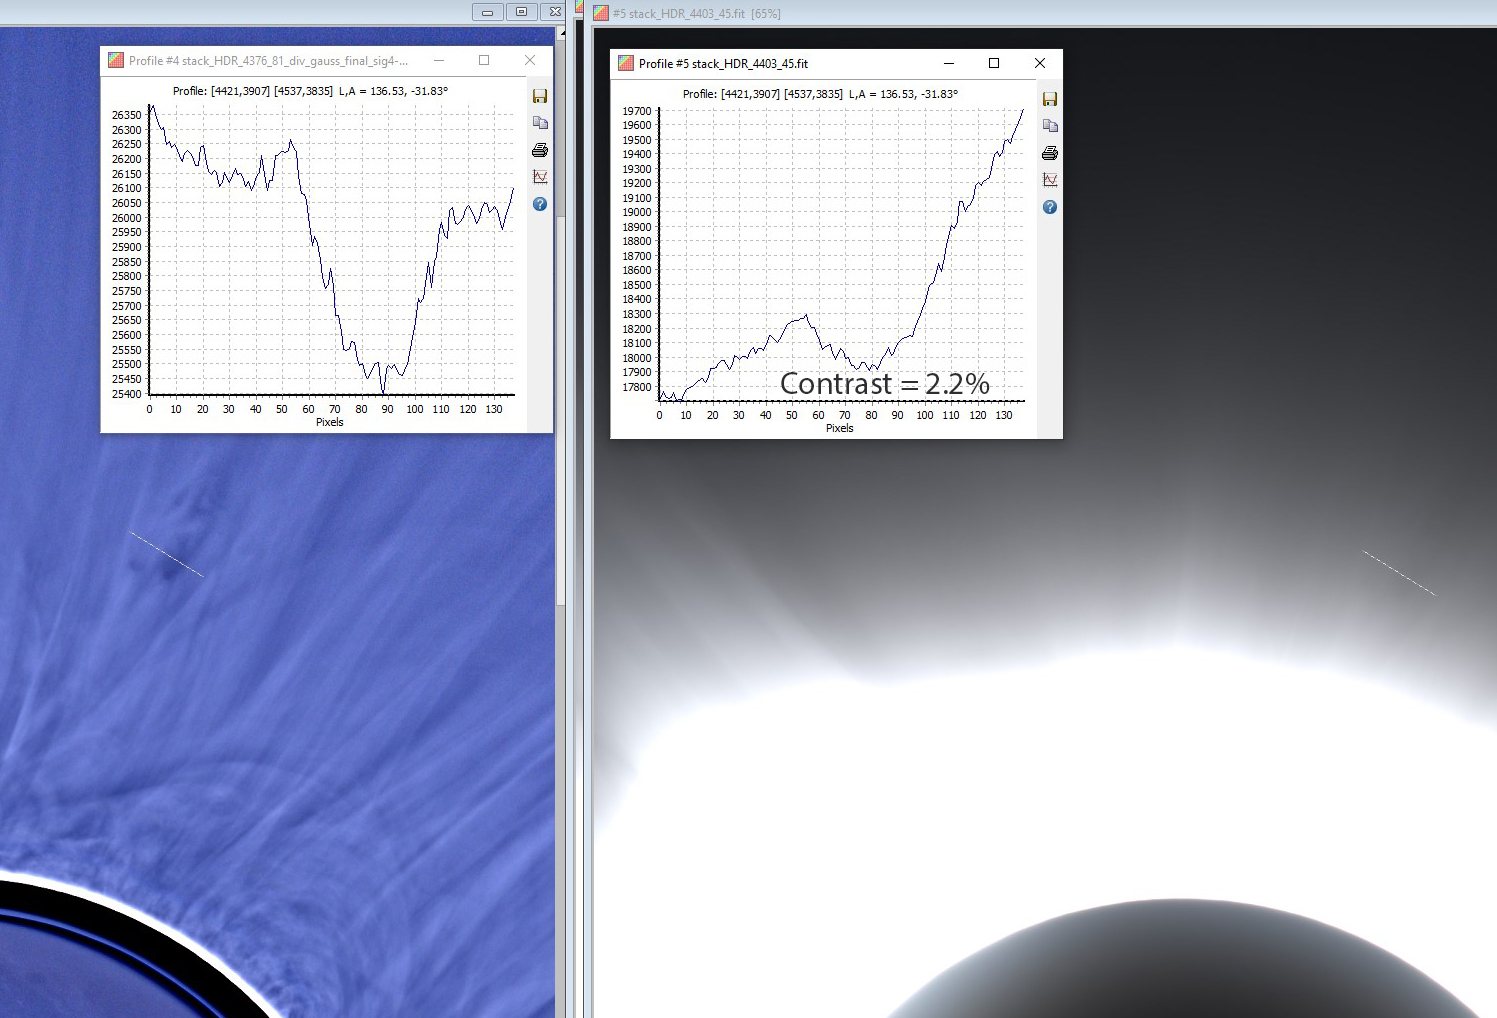
Measurement of the contrast of north blob
The contrast was measurement on the stack HDR image (stack of 45 frames centered on the period with minimal clouding, earthshine visible, no further processing, binning 1x1).
Contrast ranges from 1.1% to 2.2% depending of the position of the profile used.
Left image (radial gradient removed) is only for visualisation purpose.
C2 and C3 Contacts
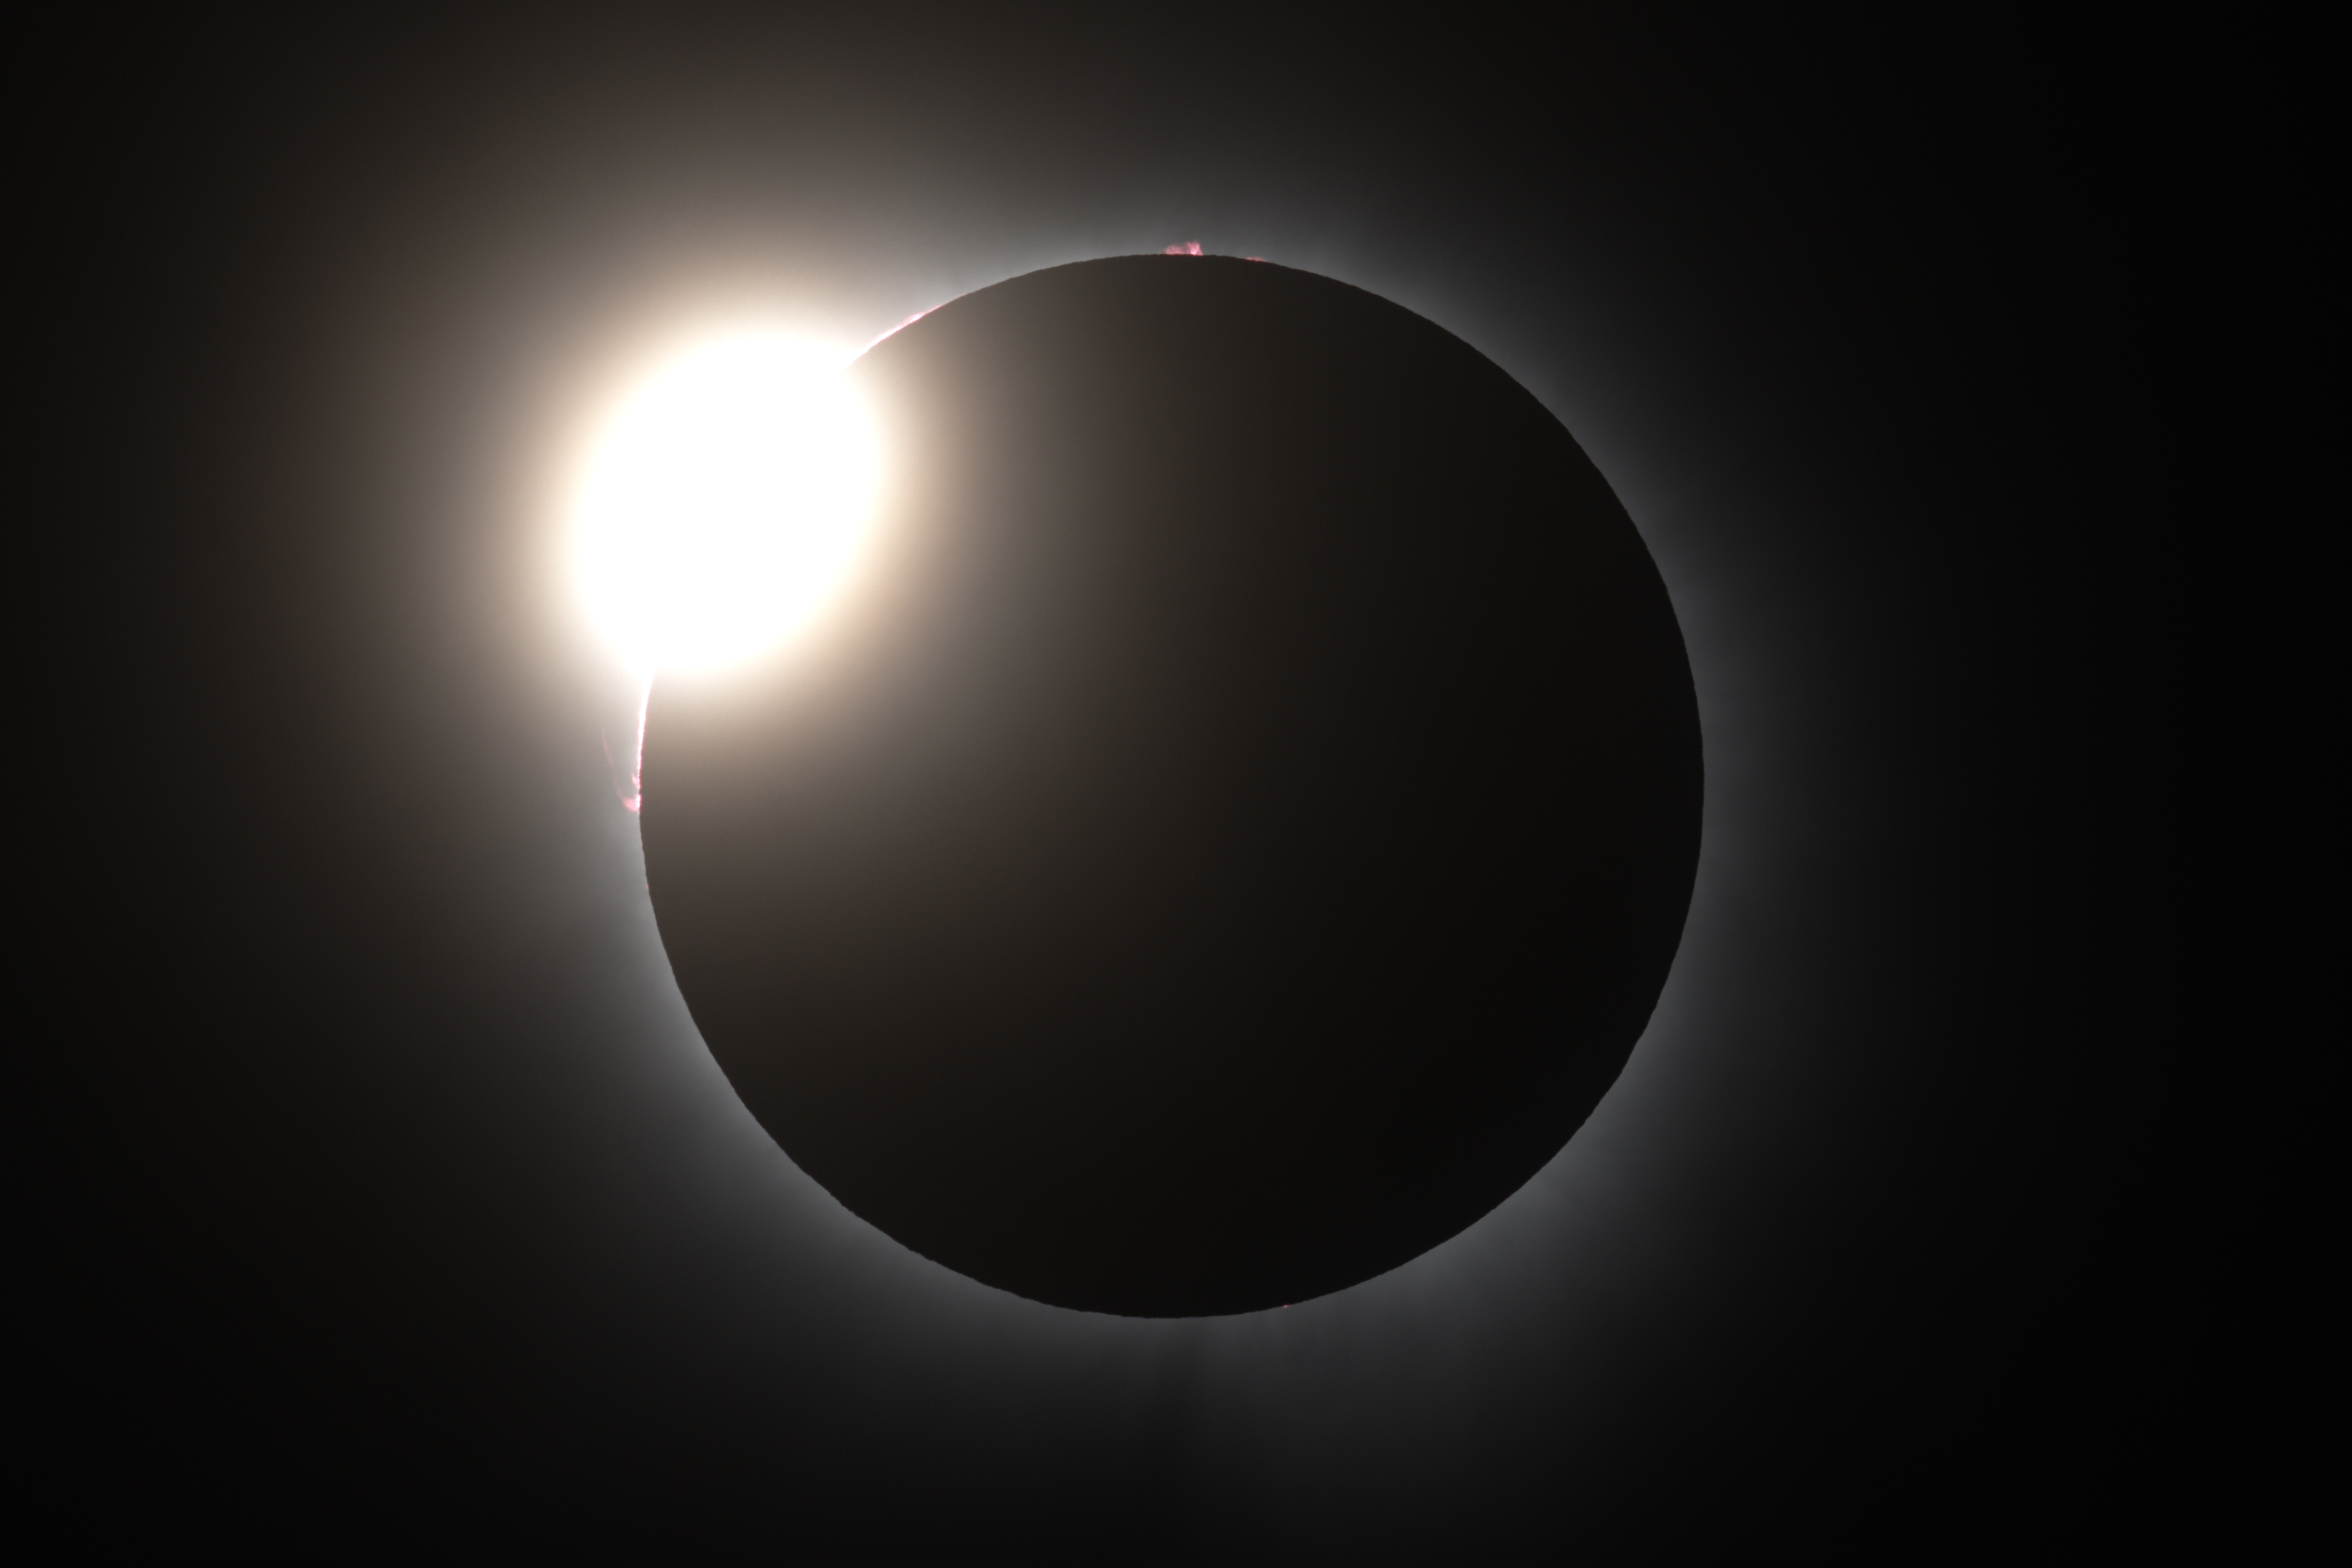
Time = C2 - 7 s, exposure = 1/250s, 100 ISO, visu log
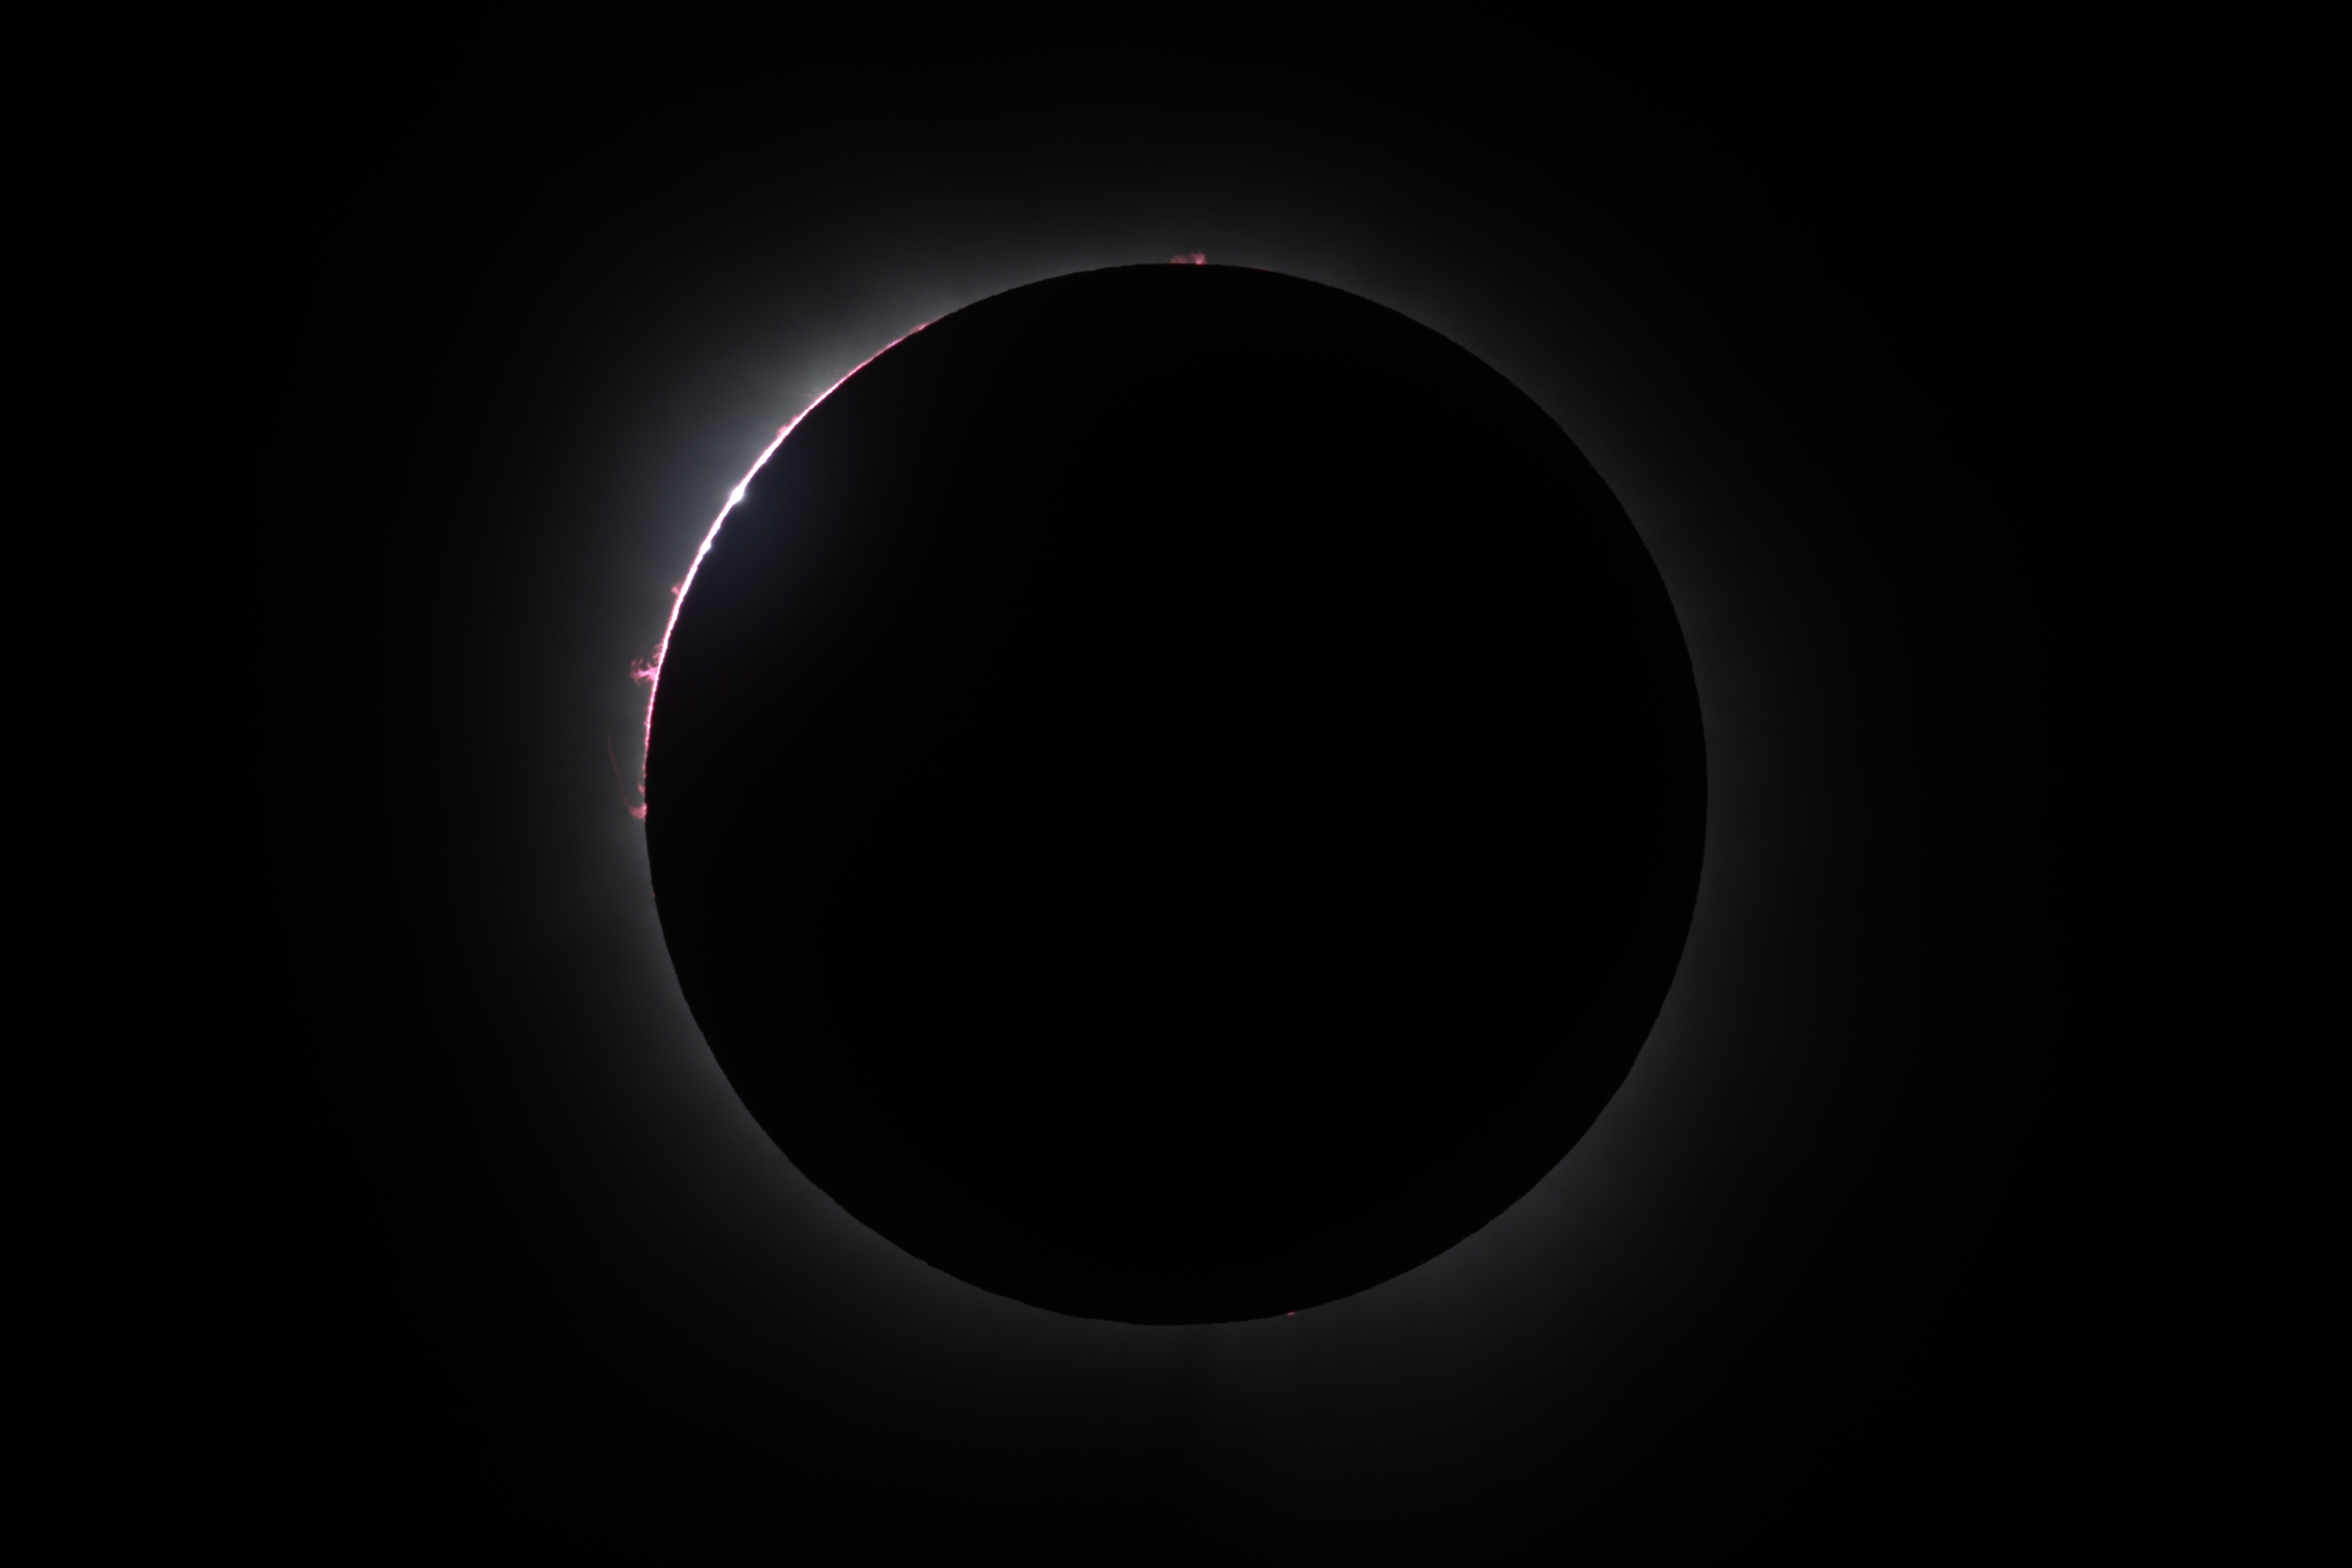
Time = C2 - 3 s, exposure = 1/500s, 100 ISO, visu log
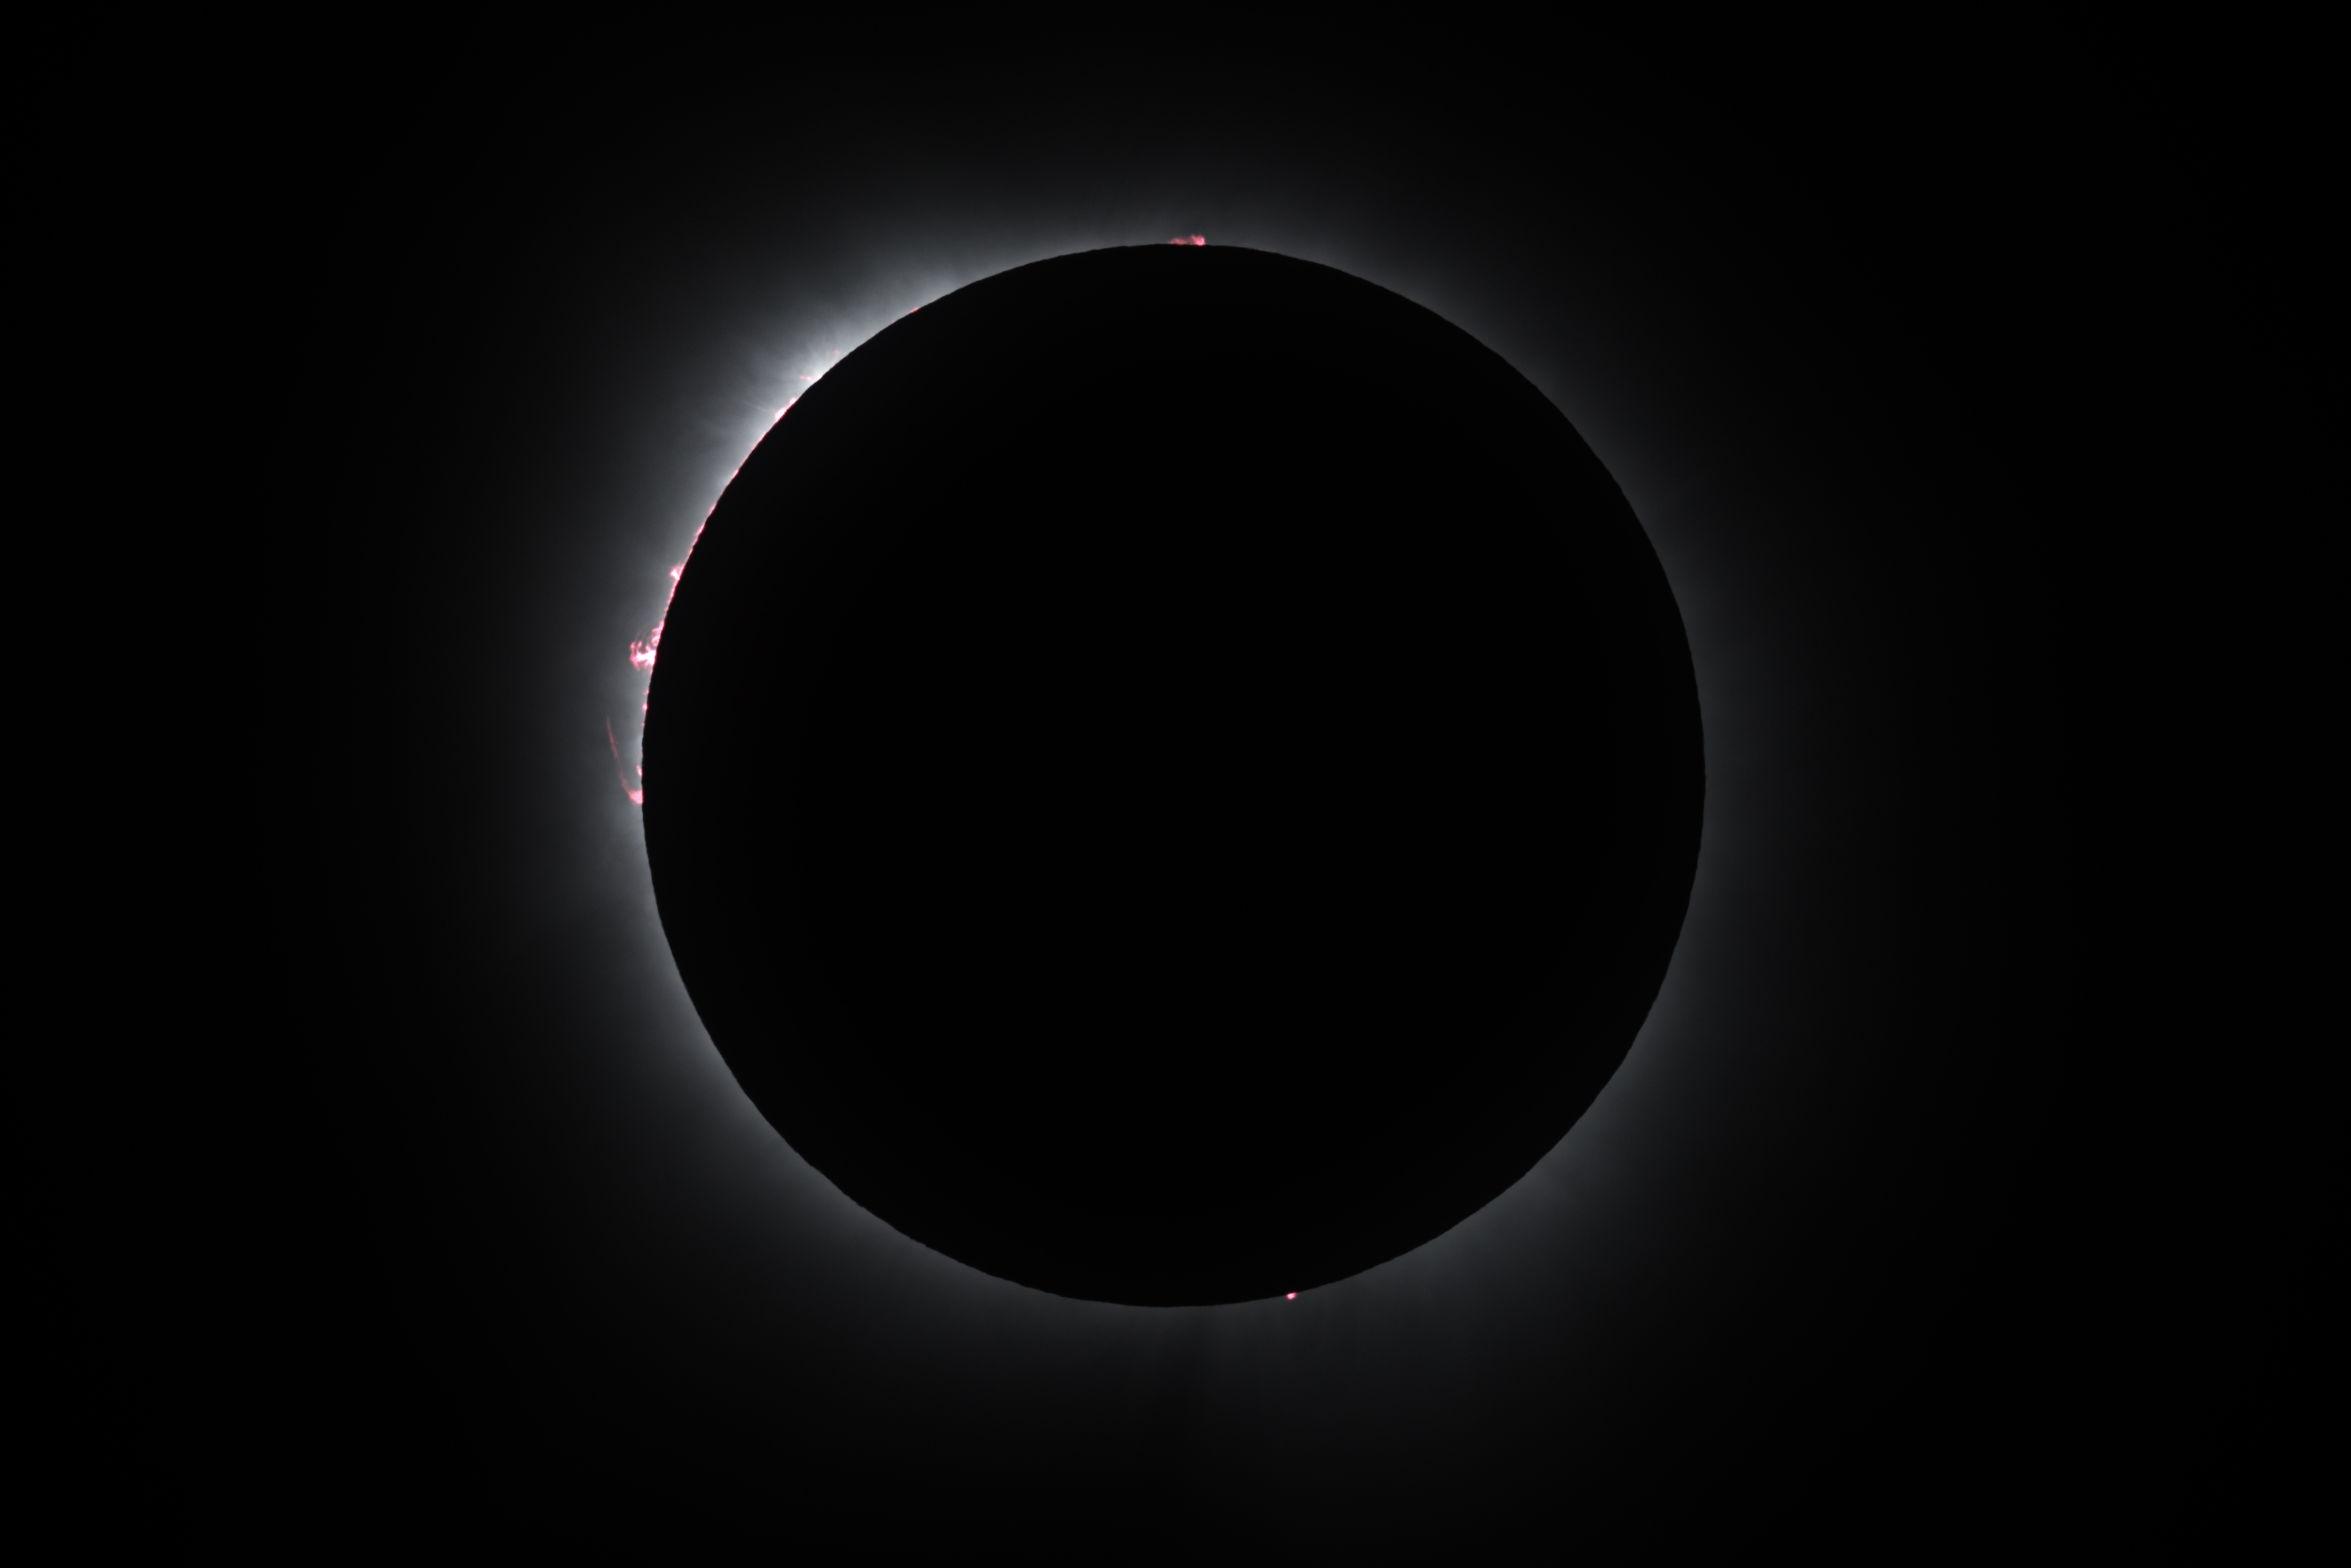
Time = C2 + 12s, exposure = 1/125s, 100 ISO, visu log
Time = C3 - 17 s, exposure = 1/125s, 100 ISO, visu log
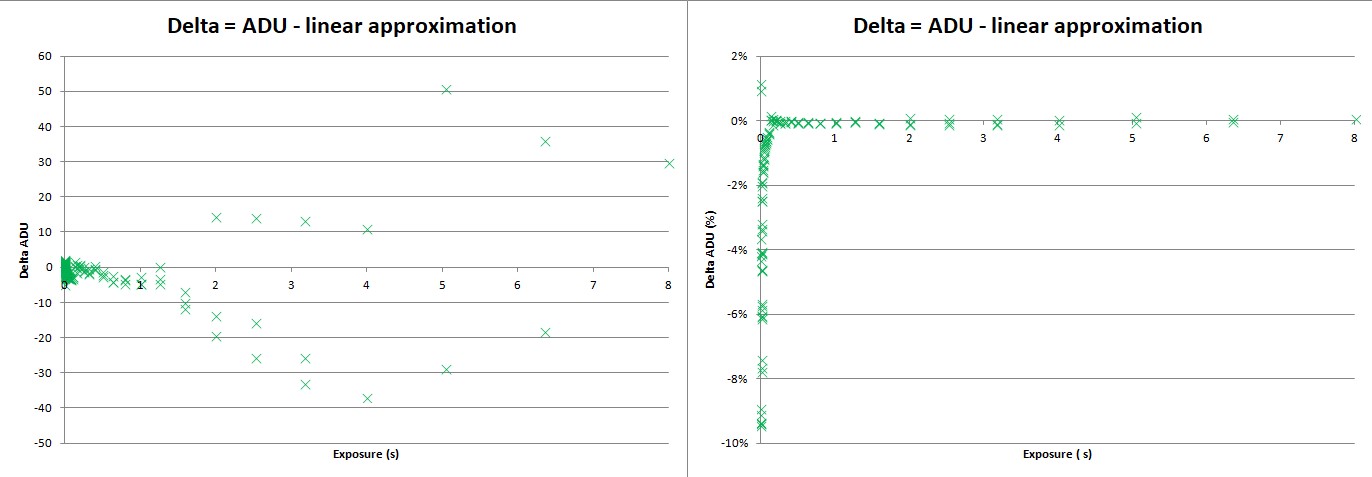
Response curve of the Nikon Z7II
Protocole :
- the source of light was a "diffuse flat source" illuminated by LED powered by a 12 VDC battery,
- the Nikon Z7II was mounted on the ZWO 80/600 refractor (in order to avoid unstability of the diaphragm aperture if a photo lens was used),
- the green channel was measured (to avoid mixing G chanel with different levels in the R and B channels, and in order to maximize S/N),
- the 500 x 500 pixels central part of the images was measured in order to have the same average ADU over the whole cropped area,
- the response curve was measured on three different runs to check stability of the measurement. For each run, exposure times are repeated twice or three times to check stability of the measurement. On a whole, the measurements were quite stable.
- to explore the full dynamic range of the sensor, exposure times range from 1/8000 s to 10 s.

Deviations from linearity were traced to incorrect exposure times written by Nikon in the metadata of the RAW files. For example a 5 s exposure is indeed a 5.03968 s exposure (=27/2).
When the exposures times were replaced by the serie T = 2 (n/3), the linear fit becomes quite good :
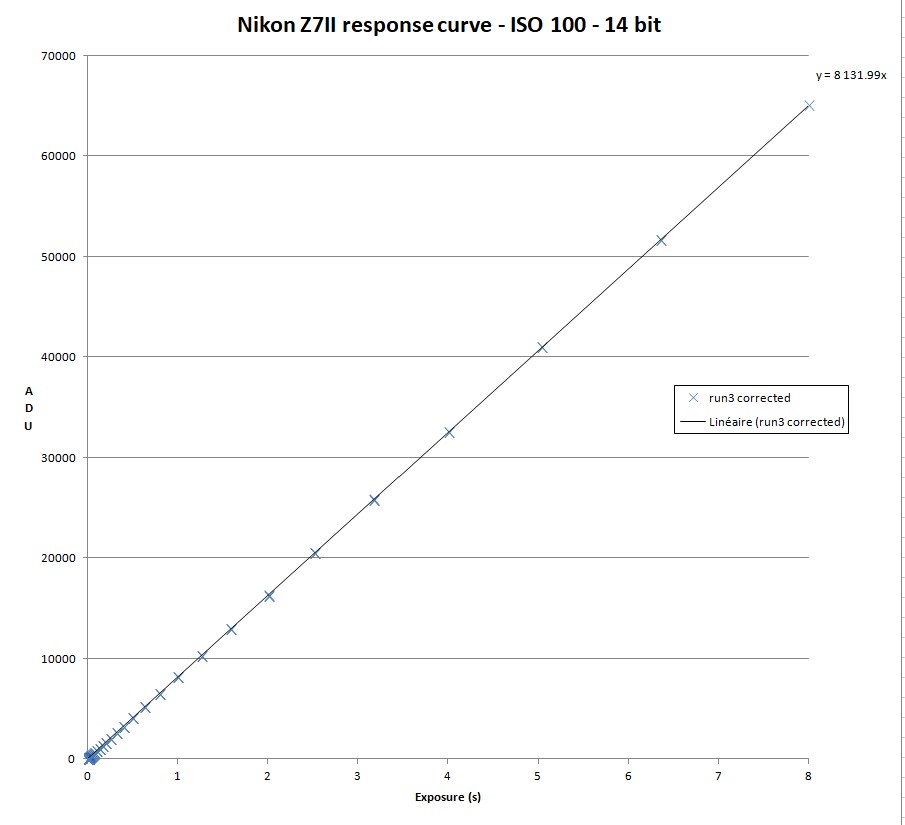
Over about 97% of the response curve (i.e. ADU > 3% Max ADU), deviation to linearity is lower than 0.1%, which is within the uncertainty of the measurements (due to very small fluctuations of the light source).